


MQ Trader System
[MQ Trader] VS Fundamental Analysis: Potential to Make More Money This Year Compare to Last Year?

A popular and simple fundamental theory promoted by some blogger on how to evaluate a stock is by analyzing the profit trend of the company. If the company is on target to achieve higher profit this year compare to the previous year, then it is deemed to be fundamentally sound, and the share price will likely follow suit to go higher.
Analyzing the profit trend of a company often involves digging through the company financial results (both quarterly and yearly), and then plot the trend line manually on an excel spreadsheet or reviewing other financial result tables. This method is tedious and error prone.
The MQ Trader system is making analysing financials data trend much simpler and quick by providing the Financials analysis function. We are going to show you how this can be done quickly and easily by using the stock VS for illustration purpose.
Users who have signed up for any package (Free Trial or Sponsored package) of the MQ Trader system can select the stock from the side bar on the left, or type in the stock code VS in the search box.
The first page you'll see is the large stock chart with Bollinger band drawn on top of the Candlestick price chart. Just click on the Stock name or the 3-line "hamburger bar" to the left of the stock name to pull out the option menu for this stock. Select the Fundamental -> Financials menu item, as per the screen capture below.

Financials Charts
You will be presented with the Quarterly Revenue Line Chart showing the Revenue trend over the past quarters. From this chart, it can be observed that the Quarterly Revenue of the company is improving steadily and is trending upward. In fact, the improvement accelerates in the past 4 Quarters, as per the screen capture below.

There are many other Financials data points you can select from the tool bar, such as Revenue, Profit, Earnings Per Share (EPS), Price Earning (PE) ratio, Dividend Per Share (DPS), Dividend Yield (DY), Net Asset Per Share (NAPS) and Return on Equity (ROE). You can also view the chart in Annual basis, as well as in Histogram or Line chart format.
Below is the sample screen capture showing Annual Profit trend in Histogram Chart format:

Fundamental Analysis on VS
Of course, traders in a hurry can also perform a quick Fundamental Analysis on this company by selecting the "Run Fundamental Analysis" option from the menu item. Below is the Fundamental Analysis result as of today, 14-Sep-2017.
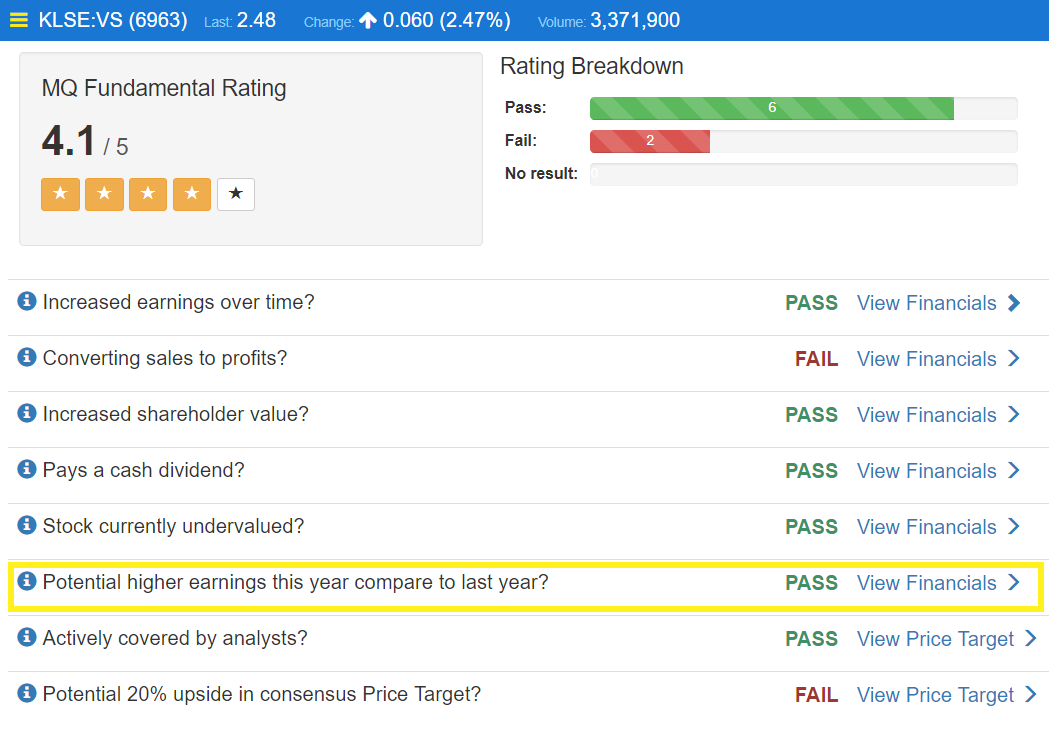
VS scores a Fundamental Rating of 4.1 over 5 by the MQ Trader Fundamental Analaysis function. It passes 6 Fundamental analysis rules, and did not pass the other 2 rules. It also passes the key rule that we cover in this article: Potential higher earnings this year compare to last year, which is highlighted in the above screen capture.
Company with Fundamental rating of 4 and above is generally considered more stable with stronger Revenue and Profit trend over the longer term.
To know more about how each rule is evaluated, traders can click on the (i) icon beside each rule name. Traders can also click on the View Financials link to see the various Financials data trend (e.g. quarterly or yearly Revenue or Profit trend) on a chart with trending line or histogram chart.
Conclusion
As you can see from the simple steps above, traders and investors can perform a very quick Fundamental Analysis on stock as of the latest date and price before deciding to trade any stock in the stock market. The analysis uses the most common criteria for Fundamental analysis, which are also commonly being used by many professional traders and investors.
Fundamental rating of 4 and above signifies the stock is fundamentally sound and business performance have been strong, which Fundamental rating of 2 and below signifies the company's business may not be performing well over long term.
Traders who are interested to read about how to perform Technical Analsis on a company can refer to our previous article: Technical and Fundamental Analysis on AIRASIA
Disclaimer
This article does not represent a BUY or SELL recommendation on the stock covered. Traders and Investors are encouraged to do their own analysis on stocks instead of blindly following any Trading calls raised by various parties in the Internet. We may or may not hold position in the stock covered, or initiate new position in the stock within the next 7 days.
Related Stocks
| Chart | Stock Name | Last | Change | Volume |
|---|
More articles on MQ Trader System
[MQ Trader] Fundamental Friday - Fundamental Analysis on Public Bank
Created by MQ Trader | Sep 15, 2017
Discussions
1 person likes this. Showing 4 of 4 comments
A company with potentially high earnings this year compare to the previous year will likely lead to increasing share price. To pass this criteria, a company must achieve higher T4Q earnings (or latest reported annual earnings) compare to the previous year's earnings.
2017-09-14 18:21
Ringgit likely to appreciate against US dollar next week
Malay Mail Online-42 minutes ago
2017-09-16 11:10
Fake ranking system! i3 push the articles from MQ to top 5 because of sponsoreship from MQ
2017-09-17 00:18
Post a Comment
Featured Posts
New Update. Discover investment communities that resonate with your ideas

MQ Trading Signals
Time
Signal
Duration
Type
2024-07-05 16:55:00
EMA 5
5 Mins
BUY
2024-07-05 16:35:00
EMA 5
5 Mins
SELL
2024-07-05 16:15:00
EMA 5
5 Mins
BUY
2024-07-05 15:00:00
EMA 5
Hourly
SELL
2024-07-05 14:30:00
EMA 5
5 Mins
SELL
Apps


Top Articles
1
TA Sector Research
BWYS Group Berhad - A Leading Sheet Metal and Scaffoldings Manufacturer
2
Kenanga Research & Investment
3
4
Kenanga Research & Investment
5
save malaysia!
6
TA Sector Research
7
8
#
Stock
Score
Daily Stocks
Stock Name
Last
Change
Volume
Stock Name
Last
Change
Volume
Stock Name
Last
Change
Volume
Featured Advertisers / Partners


Ride The Bull Short The Bear
CS Tan
4.9 / 5.0
This book is the result of the author's many years of experience and observation throughout his 26 years in the stockbroking industry. It was written for general public to learn to invest based on facts and not on fantasies or hearsay....
spanky
How do you determine if a company pass the criteria: Potential higher earning this year compare to last year?
2017-09-14 16:38