MQ Trader Backtesting - HIBISCS (5199) - 14 Sep 2018
MQTrader Jesse
Publish date: Thu, 04 Oct 2018, 12:33 PM
HIBISCS (5199)
MQ Signal Backtest Rating

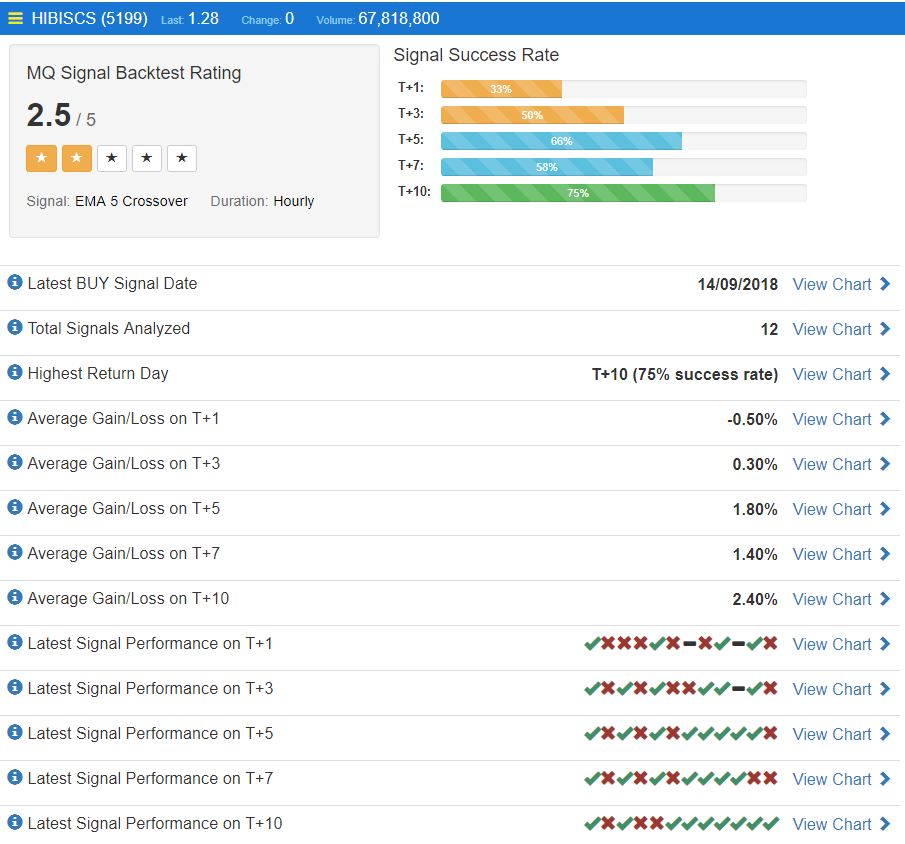
Figure 1: MQ Signal Backtesting of HIBISCS obtained on 24 Sep 2018.
MQ Robo Advisor Commentary
Background
MQ Signal Backtest service performed Live Backtesting on stock HIBISCS (5199) based on EMA 5 Crossover Trade Signal and Hourly chart duration. Up to 5 years historical data were used for this Live backtesting service.
Test Result
A total of 12 Trade Signals were analyzed. The latest Trade Signal was detected on 14/09/2018. On average, the Backtest result shows that the best performance is achieved on T+10 after trading day with 75% success rate.
Comparison between EMA 5 Crossover Hourly Chart and backtest result

Figure 2: EMA 5 Crossover Hourly Chart of HIBISCS
Based on the backtesting result, average gain on T+10 is the highest (2.4%) with the success rate of 77%. The accuracy of the backtesting is proven to be high, as 36.10% of gain can be earned if traders enter into the position on 14 Sep 2018 and dispose the share on 1 Oct 2018 (T+10) as shown in Figure 2. Besides, the signals also predicted that the share price will fall slightly (-0.5%) on T+1 and it is portrayed nearly the same by the share price in reality. A sell signal appeared indicating that the share price is dropping between T+0 and T+1. From T+3 onward, the share price is increasing steadily until it reaches T+10 where is the highest point of the share price before a sell signal is observed on 3 Oct 2018.
Conclusion
As mentioned in our previous blog post – MQ Trader – Introduction to Backtesting, a single trading strategy is impossible to fit the investment of all stocks, as all stocks exhibit different characteristics. MQ Backtesting allows us to increase the winning chance of our investment by determining the suitability of trading strategies on each stock. Hence, signals with high accuracy and quality can be identified based on MQ live backtest rating within seconds.
MQ Trader Workshop
For those who are interested in MQ backtesting, you can visit MQ Trader Workshop - Trade Signal Analysis & Backtesting With MQ Trader [Free Registration!] to know more about our coming workshop on 6 October 2018
Community Feedback
We encourage traders to try out and evaluate the MQ Trader system and provide us feedback on the features you like to see in the system. We have received many positive feedbacks so far, and we are currently compiling and reviewing them for possible inclusion into the next release of the system.
We would like to develop this system based on community feedback to cater for community needs. Thanks to all those who have provided valuable feedback to us. Keep those feedbacks coming in!
Disclaimer
This article does not represent a BUY or SELL recommendation on the stock covered. Traders and Investors are encouraged to do their own analysis on stocks instead of blindly following any Trading calls raised by various parties in the Internet. We may or may not hold position in the stock covered, or initiate new position in the stock within the next 7 days.
Join us now!
MQ Trader stock analysis system uses Artificial Intelligence (AI), various technical indicators and quantitative data to generate accurate trading signals without the interference of human's emotions and bias against any particular stock. It comprises trading strategies which are very popular among fund managers for analysing stocks.
MQ Trader stock analysis system is SPONSORED for MQ Trader members. To use this amazing tool, you can sign up via MQ Trader Sign Up!
Contact us
Please do not hesitate to contact us if you have any enquiry:
Related Stocks
| Chart | Stock Name | Last | Change | Volume |
|---|
More articles on MQTrader Stock Discussion
Created by MQTrader Jesse | May 20, 2021
Created by MQTrader Jesse | Jul 05, 2019
Created by MQTrader Jesse | Jun 03, 2019


Fantastico
Backtesting only works with Historical Price
2018-10-04 20:45