


MQTrader Stock Discussion
MQ Trader Analysis - TEO SENG (7252) - The company that lays golden eggs?

MQTrader Jesse
Publish date: Fri, 05 Jul 2019, 12:35 PM
TEO SENG (7252)
Teo Seng Capital Bhd engages in poultry farming business. The company operates through Investment Holding; Trading of Pet Food, Medicine, and Other Related Products; and Poultry Farming segments. It produces eggs. The firm also manufactures and markets paper egg trays and animal feeds, as well as distribute food, medicine, and other health products. In addition, it trades in and generates energy through the establishment of biogas plants; and is involved in the wholesale, import, and export of eggs products. Further, the firm provides waste management and cool room services. It also produces, processes, preserves, and wholesales meat and meat related products; and engages in the fertilizer and agriculture businesses. The firm earns most of its revenue from Poultry Farming segment.
Fundamental Analysis
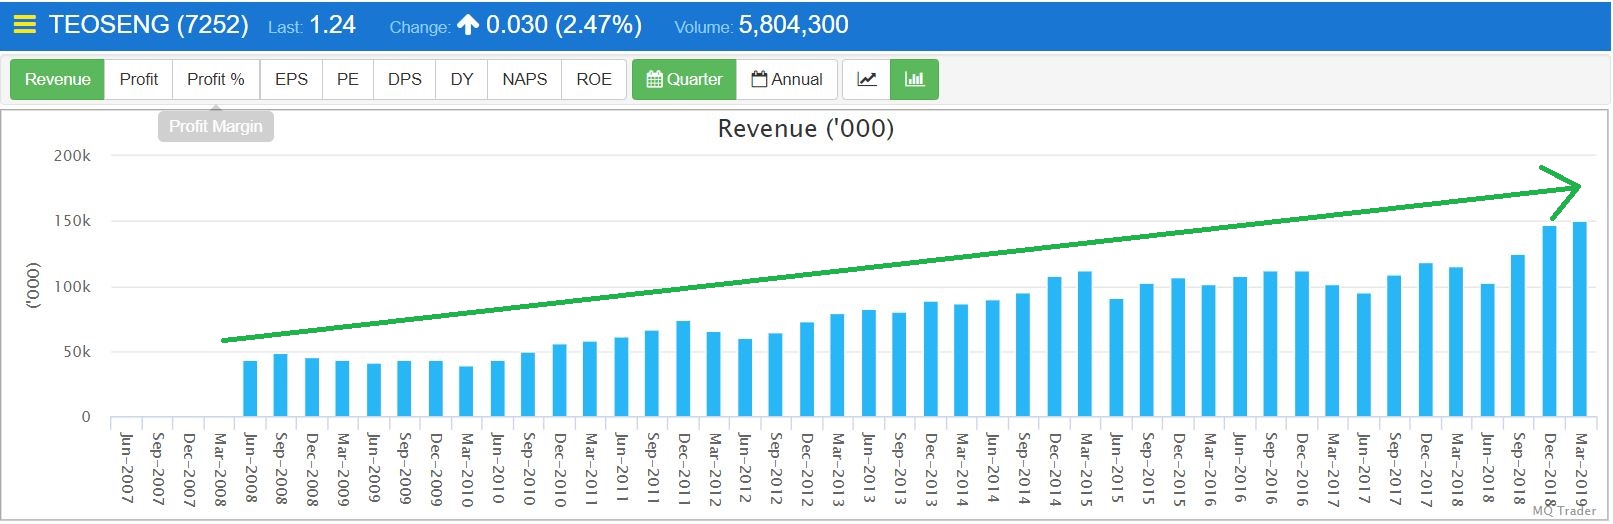
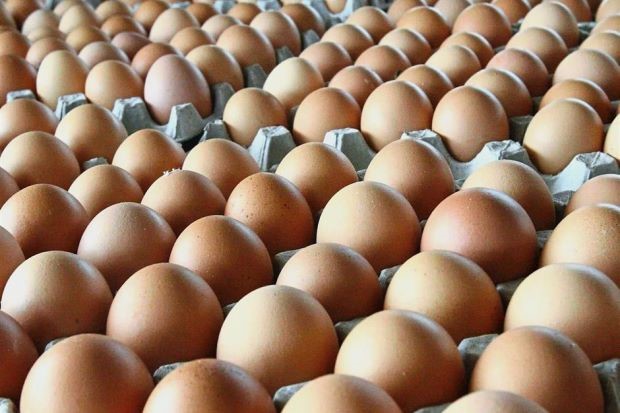
Figure 1: Quarter revenue of TEO SENG
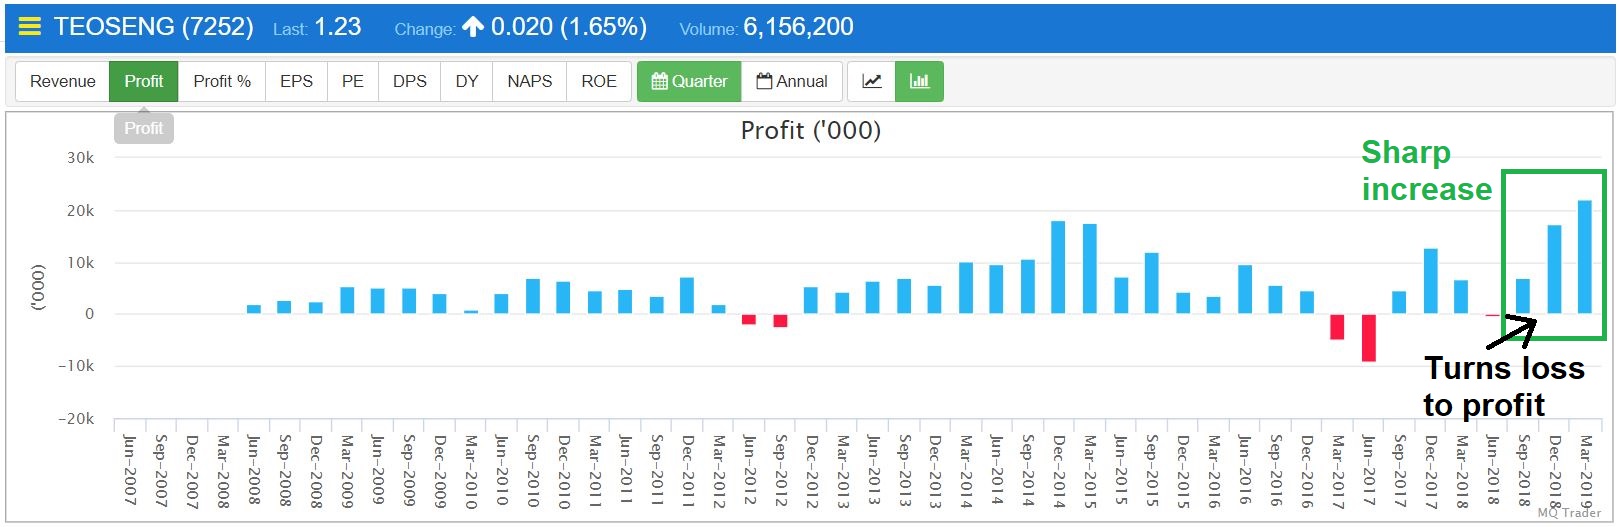
Figure 2: Quarter profit of TEO SENG
Figure 3: Quarter Earnings per Share (EPS) of TEO SENG
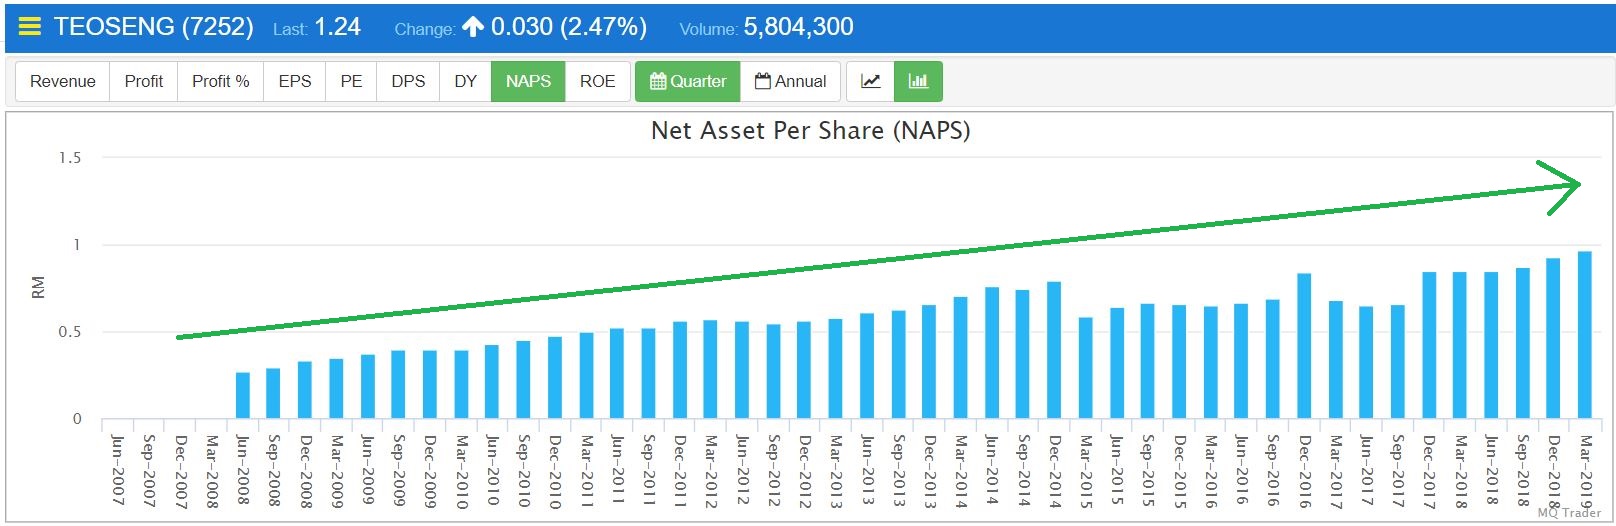
Figure 4: Quarter net asset per share (NAPS) of TEO SENG
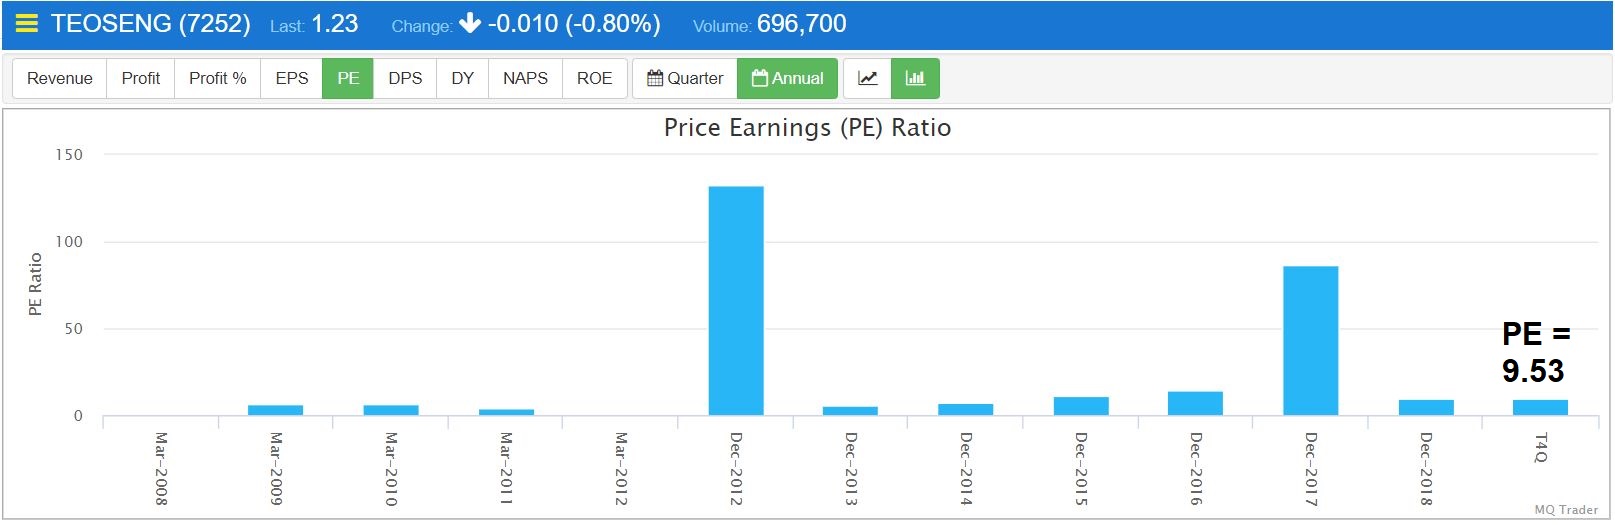
Figure 5: Annual Price Earning (PE) ratio of TEO SENG
The figure above shows that there is a remarkable improvement in TEO SENG’s financial for the last 3 quarters, as TEO SENG has turned loss to profit with tremendous growth for 3 quarters consecutively in 3Q18. The trend of TEO SENG’s quarter EPS is similar with its quarter profit’s indicating that the dilution of its share value is negligible over the years. Besides, the NAPS of TEO SENG is increasing constantly over the years showing that the value of its share is appreciating in the long term. TEO SENG is also undervalued currently, as its PE ratio is only 9.53 (PE<15).
MQ Fundamental Analysis
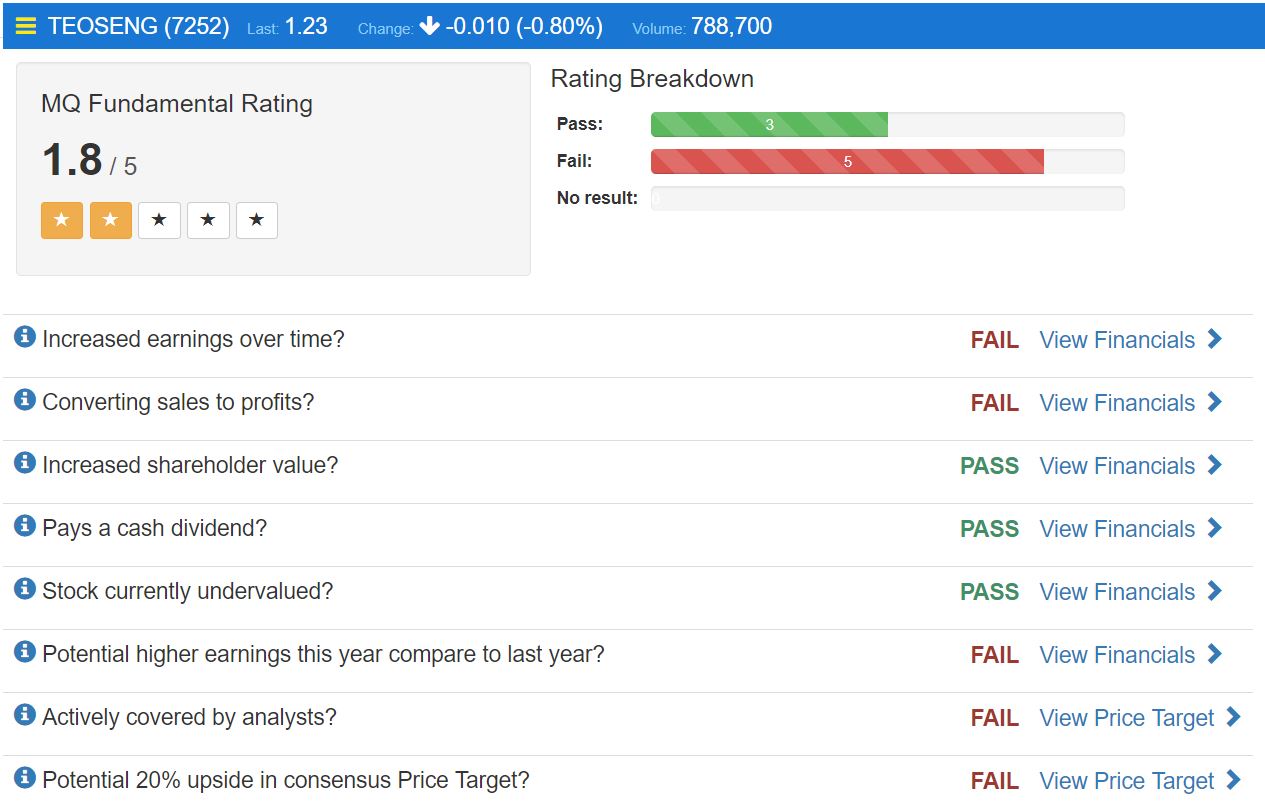
Based on MQ Fundamental Analysis, TEO SENG is not considered as a stock with good fundamentals, as it scores 1.8/5.0 for MQ Fundamental Rating. According to MQ Trader criteria, a stock with good fundamentals should achieve at least 2.5/5.0 for MQ Fundamental Rating. One of the main reasons that deteriorate its MQ Fundamental Rating is its failure to convert the sales to profit consecutively for 4 out of 5 years. Hence, the subsequent annual reports are very crucial to determine the sustainability of TEO SENG’s growing profitability in the long run.
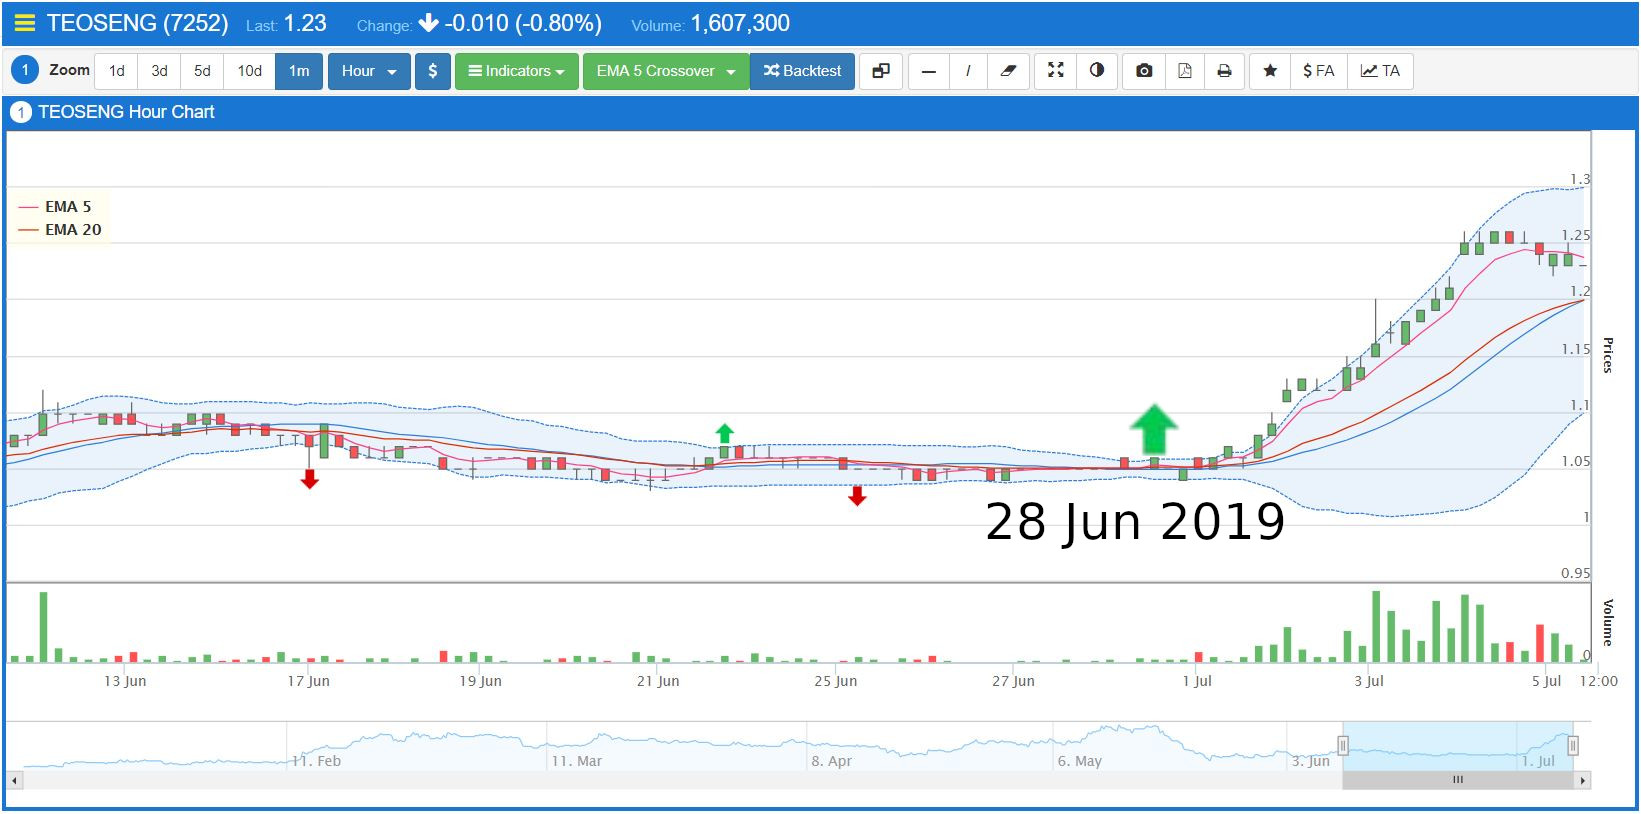
1 Year Technical Chart
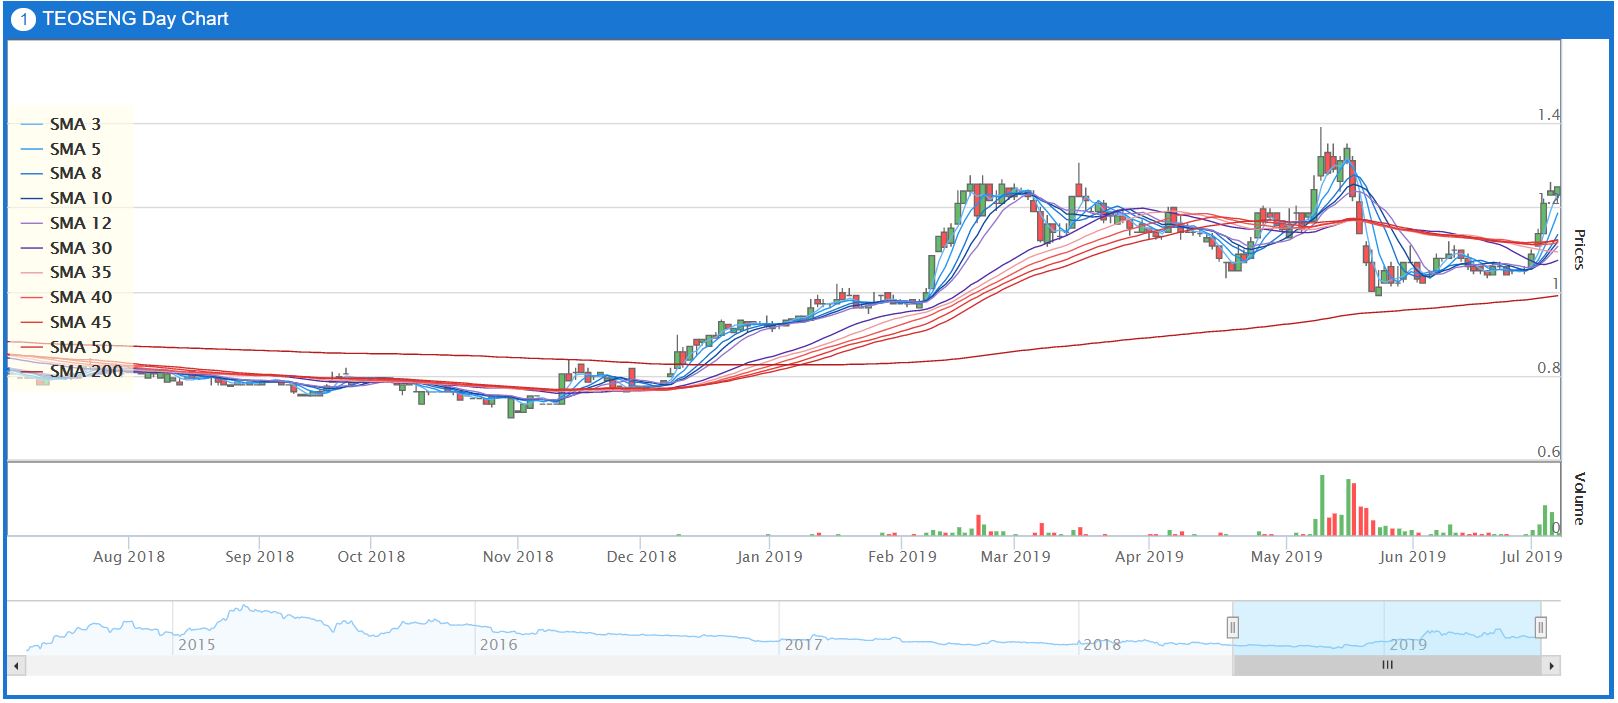
Guppy MMA is used to identify the trend of TEO SENG’s share price in a year as shown in the figure above. TEO SENG’s share price is observed to ride on a positive momentum in the long term especially when its share price is on uptrend for approximately half a year. Furthermore, there is a sharp increase in its share price took place indicating that the buying pressure is growing exponentially recently.
Technical Analysis
MQ Technical Rating
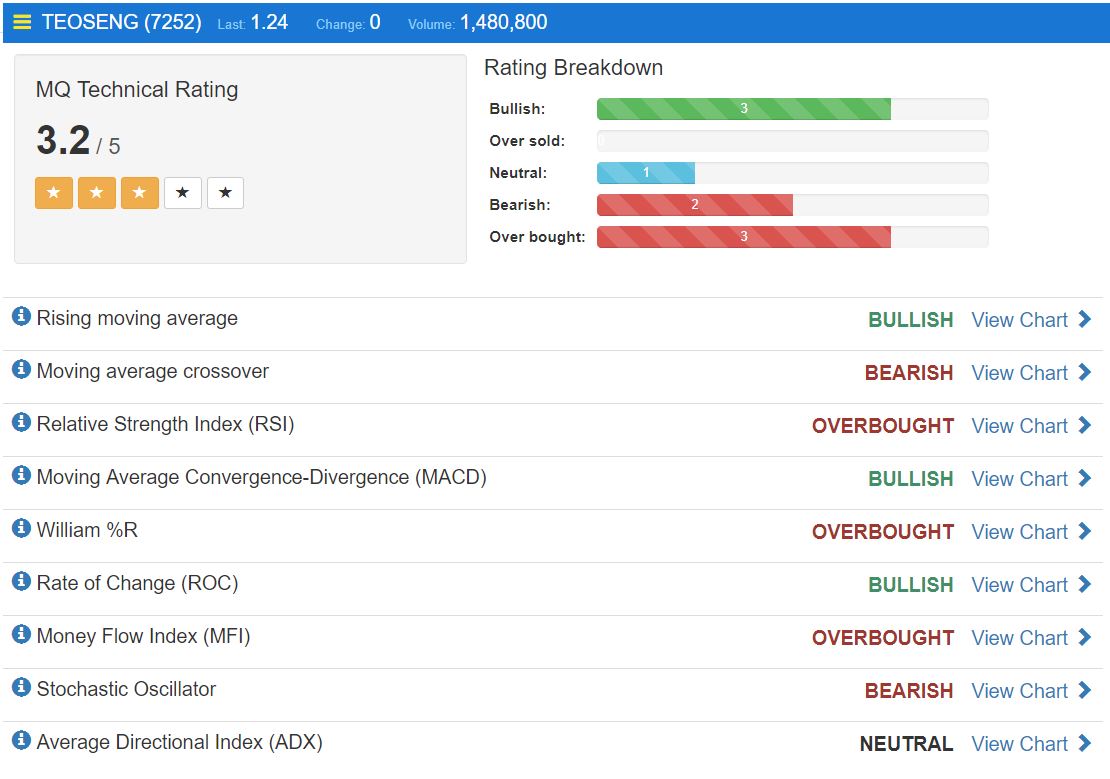
TEO SENG’s MQ Technical Rating is 3.2/5.0 which indicates the recovery of buy momentum on its share currently.
Majority of MQ Trader trading strategies captured buy signals with strong buy momentum in the end of June 2019. This reflects the positive impact brought by its strong profit margin with exponential growth for the last 3 quarters.
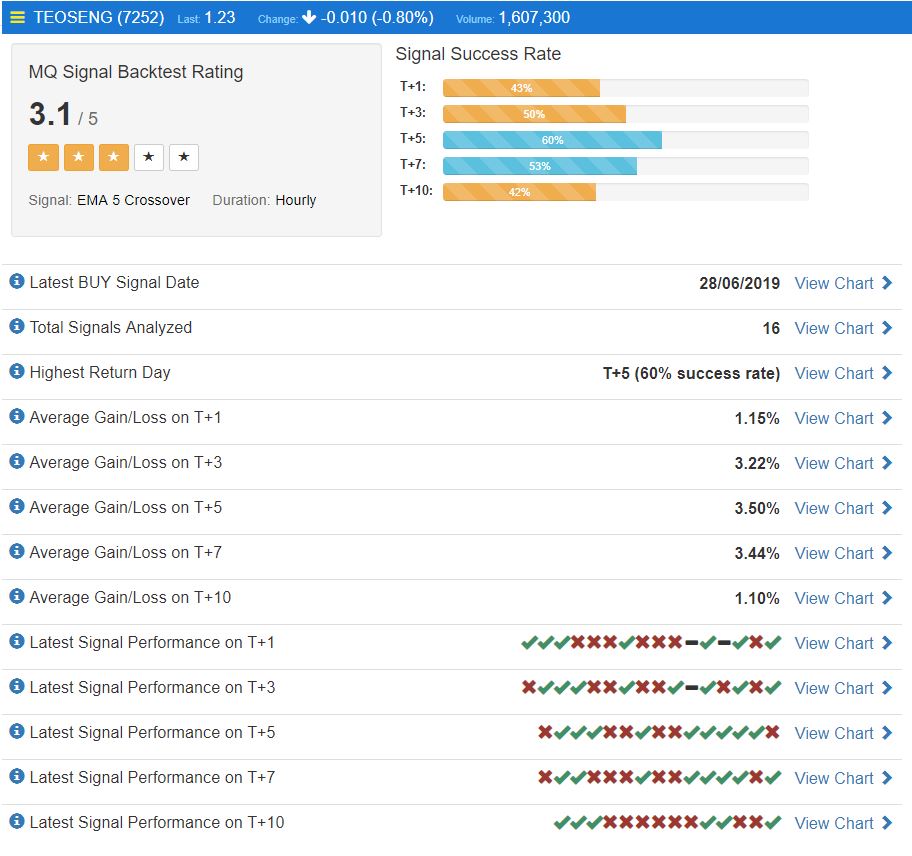
To confirm the signal quality, MQ Backtesting is used to determine the success rate of the signal. Based on the MQ Backtesting result, the highest backtesting rating achieved is 3.1/5.0 which is a positive rating. In short, traders can start to grab the opportunity, as there are chances for the share price to rise within 10 trading days.
MQ Trader’s ViewBased on the analysis above, TEO SENG’s share price will continue the positive momentum until the next quarter due to its excellent last quarter result. The factors that can drag down its share price in the next quarter:
|
Conclusion
In our opinion, we will start to look for the right spot to enter our position to grab the opportunity of TEO SENG’s positive momentum in the short term. At the same time, we will monitor our position closely until there is any news that can affect its share price announced. For long term wise, we will wait for next annual financial results to determine the ability of TEO SENG to maintain its profitability for a long period.
MQ Trader Analysis Tool
To view VIZIONE’s fundamental analysis on MQ Trader: https://klse.i3investor.com/mqtrader/sf/analysis/fa/7252
To view VIZIONE's technical analysis on MQ Trader: https://klse.i3investor.com/mqtrader/sf/analysis/stkta/7252
To know more about MQ Trader system, please visit MQ Trader Education Series.
Community Feedback
We encourage traders to try out and evaluate the MQ Trader system and provide us feedback on the features you like to see in the system. We have received many positive feedbacks so far, and we are currently compiling and reviewing them for possible inclusion into the next release of the system.
We would like to develop this system based on community feedback to cater for community needs. Thanks to all those who have provided valuable feedback to us. Keep those feedbacks coming in!
Disclaimer
This article does not represent a BUY or SELL recommendation on the stock covered. Traders and Investors are encouraged to do their own analysis on stocks instead of blindly following any Trading calls raised by various parties in the Internet. We may or may not hold position in the stock covered, or initiate new position in the stock within the next 7 days.
Join us now!
MQ Trader stock analysis system uses Artificial Intelligence (AI), various technical indicators and quantitative data to generate accurate trading signals without the interference of human's emotions and bias against any particular stock. It comprises trading strategies which are very popular among fund managers for analysing stocks.
MQ Trader stock analysis system is SPONSORED for MQ Trader members. To use this amazing tool, you can sign up via MQ Trader Sign Up!
Contact us
Please do not hesitate to contact us if you have any enquiry:
Email: admin@mqtrader.com
Related Stocks
| Chart | Stock Name | Last | Change | Volume |
|---|
More articles on MQTrader Stock Discussion
MQ Trader Analysis - GAMUDA (5398) - Road to recovery from Pandemic
Created by MQTrader Jesse | May 20, 2021
MQ Trader Analysis - INTA (0192) - Safe sail through the stormy weather in construction
Created by MQTrader Jesse | Jun 03, 2019
Discussions
Be the first to like this. Showing 0 of 0 comments
Post a Comment
Featured Posts
Introducing MY's First IPO Fund for Sophisticated Investors!
New Update. Discover investment communities that resonate with your ideas
M & A Value Partners IPO Equity Fund has been launched - Targeted 13% Return p.a
Latest Videos


MQ Trading Signals
Time
Signal
Duration
Type
2024-07-18 16:05:00
EMA 5
5 Mins
SELL
2024-07-18 16:00:00
TURTLE SYSTEM 20
10 Mins
SELL
2024-07-18 16:00:00
TURTLE SYSTEM 55
10 Mins
SELL
2024-07-18 15:55:00
ADX
5 Mins
SELL
2024-07-18 15:40:00
TURTLE SYSTEM 20
5 Mins
SELL
Apps


Top Articles
1
CEO Morning Brief
PGF Capital to Distribute Thermal Insulated Panels for Data Centres
2
Good Articles to Share
3
4
Rakuten Trade Research Reports
6
Bimb Research Highlights
7
RHB Investment Research Reports
8
南洋行家论股
#
Stock
Score
Daily Stocks
Stock Name
Last
Change
Volume
Stock Name
Last
Change
Volume
Stock Name
Last
Change
Volume
Featured Advertisers / Partners


Ride The Bull Short The Bear
CS Tan
4.9 / 5.0
This book is the result of the author's many years of experience and observation throughout his 26 years in the stockbroking industry. It was written for general public to learn to invest based on facts and not on fantasies or hearsay....