Rakuten Trade Research Reports
Tehnical View- TCS Group Holdings Bhd
rakutentrade
Publish date: Fri, 27 Nov 2020, 08:54 AM
TCS Group Holdings Bhd (0221)
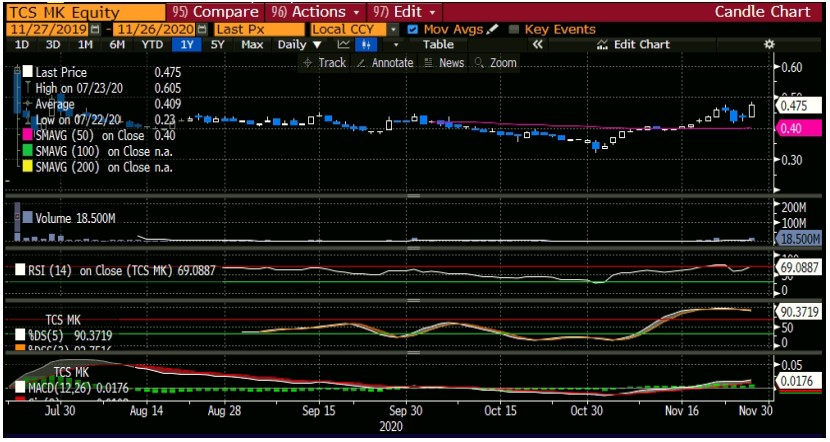
• TCS jumped 9.1% or 4 sen to RM0.475 yesterday.
• Yesterday’s active trading volume saw a bullish breakout from key resistances level indicating strong buying interest. Chart-wise, it has broken out of its consolidation and is poised for a bullish uptrend with key positive indicators signalling bullish momentum which is likely to see it head towards the RM0.60 level.
• As such, resistance levels are found at RM0.52 (R1) and RM0.60 (R2) level.
• On the downside, support levels are identified at RM0.42 (S1) and RM0.37 (S2).
Source: Rakuten Research - 27 Nov 2020
Related Stocks
| Chart | Stock Name | Last | Change | Volume |
|---|
More articles on Rakuten Trade Research Reports
Supreme Consolidated Resources Bhd - Producers + Consumers = SUPREME
Created by rakutentrade | Nov 22, 2024
Discussions
Be the first to like this. Showing 0 of 0 comments


