FTSE Singapore Straits Times Index - Bearish Expectation Ahead
rhboskres
Publish date: Fri, 01 Jun 2018, 06:21 PM

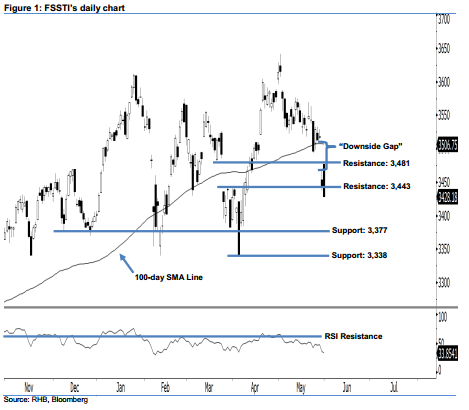
Negative indicators suggest that the 1-month correction is not at limit yet. The FSSTI dropped 15.77 pts to 3,428.18 pts yesterday, extending the 1-month correction to its newest low since April. This shows a continuation of the firm bearish bias we saw in the prior session, where the index has plunged below the 100-day SMA line. Presently, we think that the bears are dominating market sentiment and the correction is likely to extended more. This is supported by the “Downside Gap” continuation pattern on 30 Apr, which suggests that the downside movement may still resume further.
The fact that the index is currently fluctuating below the 100-day SMA line points towards a weak outlook. In addition, we also highlight that the 14-day RSI indicator is situated below the 50-pt neutral level at 33.85 pts, which implies that market sentiment is weak. All these negative indicators support our downside view.
Our immediate support is now at the 3,377-pt mark, or the low of 7 Dec 2017. This is followed by the 3,338-pt support threshold, obtained from the low of 4 Apr. Conversely, we revise the immediate resistance to 3,443 pts, which was the high of 27 Mar. If this level is taken out, the next resistance is pegged at 3,481 pts, which was the low of 20 Mar.
Source: RHB Securities Research - 1 Jun 2018
More articles on RHB Retail Research
Created by rhboskres | Aug 26, 2024


