FBM Small Cap Index - Rebound May Extend Further
rhboskres
Publish date: Tue, 05 Jun 2018, 09:20 AM

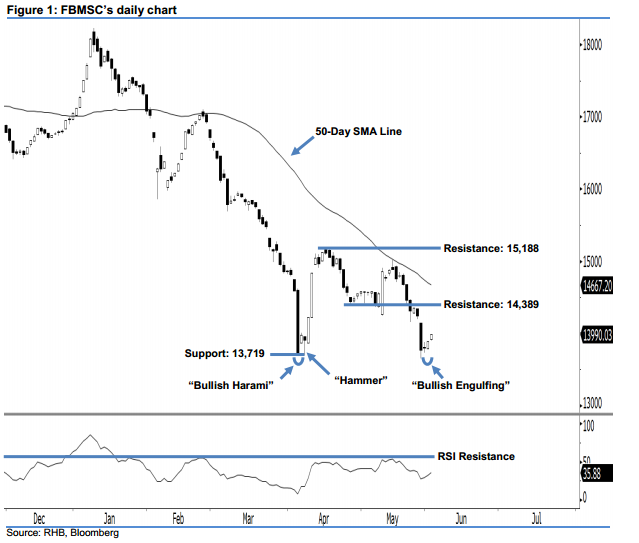
The bullish bias is still exerting itself, the positive view is extended. After the appearance of 1 Jun’s reversal “Bullish Engulfing” candlestick pattern, the FBMSC climbed 99.97 pts yesterday to 13,990.03 pts. It left a white candle without any upper shadow after having oscillated between a low of 13,899.67 pts and high of 13,990.03 pts. We think the bullish bias is still in play above the 13,719-pt support. This could be the index’s bottom, since we saw significant bullish reversal signals at its 2-year low, ie 5 Apr’s “Bullish Harami” and 6 Apr’s “Hammer” patterns. Overall, our positive view remains intact.
The bullish bias is currently developing above the abovementioned support, which may put an end to the correction that happened during the 17-30 May period. Based on the immediate momentum, chances are high that the rebound is likely to extend more.
Our immediate support is maintained at 13,719 pts, which is located at the low of 5 Apr’s “Bullish Harami” pattern. For the next support, look to 13,116 pts, ie 25 Aug 2015’s low. Conversely, we set the immediate resistance at 14,389 pts, which was the low of 26 Apr’s “Bullish Harami” pattern. This is followed by the 15,188-pt resistance, or the high of 17 Apr.
Source: RHB Securities Research - 5 Jun 2018
More articles on RHB Retail Research
Created by rhboskres | Aug 26, 2024


