FBM Small Cap Index - May Still Climb Further
rhboskres
Publish date: Wed, 06 Jun 2018, 04:38 PM

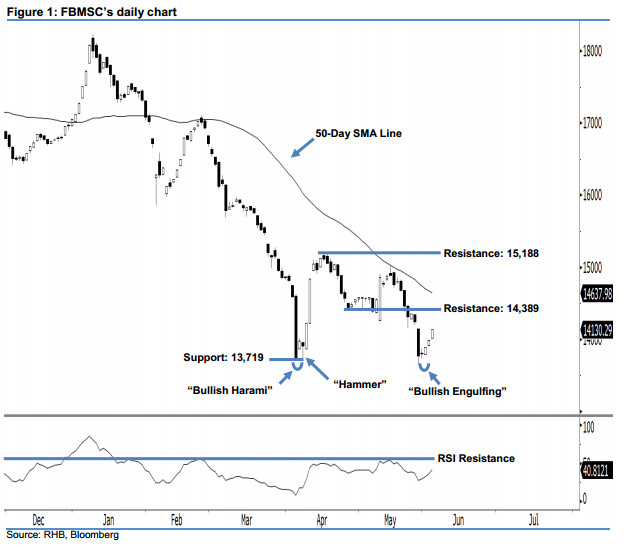
Positive view remains in play, in line with the ongoing bullish bias. The FBMSC ended yesterday’s session at 14,130.29 pts and registered a 140.26-pt gain. A white candle was formed after the index oscillated between a low of 14,010.12 pts and high of 14,136.01 pts, which implied that the bulls were in control of the session. The bullish bias we observed in 1 Jun’s reversal “Bullish Engulfing” candlestick pattern continues to exert itself and, based on the immediate positive momentum, chances are high that the FBMSC may climb further and test the 14,389-pt resistance in later sessions.
Overall, our positive view remains in play, as we think the index has found bottom at around 13,719 pts. This is also supported by the appearance of two significant bullish reversal signals at the FBMSC’s 2-year lows, ie 5 Apr’s “Bullish Harami” and 6 Apr’s “Hammer” patterns.
To the downside, we set the immediate support at 13,719 pts, or the low of 5 Apr’s “Bullish Harami” pattern. This is followed by the 13,116-pt support, which was the low of 25 Aug 2015. On the flip side, our immediate resistance is set at 14,389 pts – this is the low of 26 Apr’s “Bullish Harami” pattern. The following resistance is maintained at 15,188 pts, which is located at 17 Apr’s high.
Source: RHB Securities Research - 6 Jun 2018
More articles on RHB Retail Research
Created by rhboskres | Aug 26, 2024


