


RHB Retail Research
FBM Small Cap Index - From Downside Towards Upside

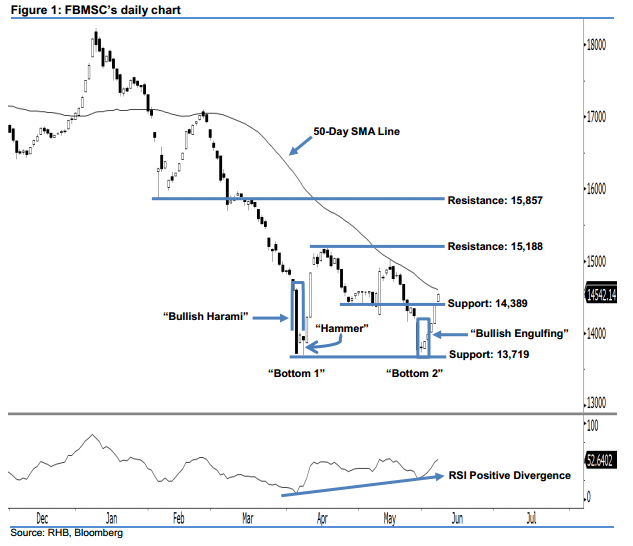
More positive indicators support our positive view. Yesterday’s session was led by the bulls, as the FBMSC jumped 143.44 pts to 14,542.14 pts. As a result, the index broke above the previous 14,389-pt resistance and is heading towards the 50-day SMA line. Presently, we believe it is regaining positive momentum and more upside movement is likely to occur later. Note that we initially thought the FBMSC found bottom at around the 13,719-pt support. This is after the appearance of significant reversal signals at the index’s 2-year low, ie 5 Apr’s “Bullish Harami” and 6 Apr’s “Hammer” patterns.
Today we highlight an important “Double Bottom” reversal pattern, given that the April and May’s lows are relatively situated around the same level – ie the abovementioned support. In addition, a “Positive Divergence” pattern was also observed in the daily chart. Technically speaking, these patterns suggest a high possibility that the trend may change towards the upside from downside previously.
Our immediate support is now at 14,389 pts, which is located at the low of 26 Apr’s “Bullish Harami” pattern. This is followed by the 13,719-pt support, ie the low of 5 Apr’s “Bullish Harami” pattern. Conversely, we revise the immediate resistance at 15,188 pts, or the high of 17 Apr. This is followed by the 15,857-pt resistance, which was the low of 6 Feb’s “Hammer” pattern.
Source: RHB Securities Research - 8 Jun 2018
More articles on RHB Retail Research
Duopharma Biotech - Lacking Near-Term Re-Rating Catalysts; D/G NEUTRAL
Created by rhboskres | Aug 26, 2024
Discussions
Be the first to like this. Showing 0 of 0 comments
Post a Comment
Featured Posts
Introducing MY's First IPO Fund for Sophisticated Investors!
New Update. Discover investment communities that resonate with your ideas
M & A Value Partners IPO Equity Fund has been launched - Targeted 13% Return p.a
Latest Videos


Apps


Top Articles
1
THE INVESTMENT APPROACH OF CALVIN TAN
2
Koon Yew Yin's Blog
3
save malaysia!
5
6
7
8
Mercury Securities Research
#
Stock
Score
Daily Stocks
Stock Name
Last
Change
Volume
Stock Name
Last
Change
Volume
Stock Name
Last
Change
Volume
MQ Trading Signals
Stock
Time
Signal
Duration
Stock
Time
Signal
Duration
Featured Advertisers / Partners


Ride The Bull Short The Bear
CS Tan
4.9 / 5.0
This book is the result of the author's many years of experience and observation throughout his 26 years in the stockbroking industry. It was written for general public to learn to invest based on facts and not on fantasies or hearsay....