


RHB Retail Research
FBM Small Cap Index - Climbing Towards North

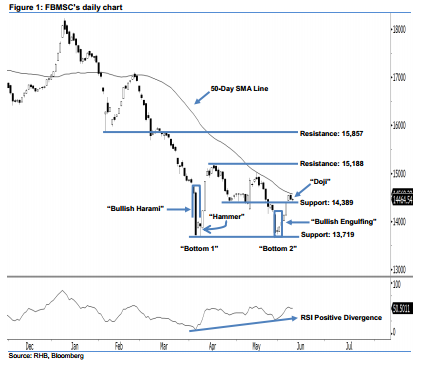
Our positive view remains in play above the 13,719-pt level. The FBMSC ended yesterday’s session at 14,464.54 pts and posted a 5.64-pt increase. A “Doji” candlestick pattern was formed, after the index oscillated between a low of 14,414.86 pts and high of 14,494.41 pts. This shows that both the bulls and bears were unable to take firm control at the end of the day. As long as the FBMSC is able to stay above the 13,719-pt support, we believe the 2-month bullish bias remains in play.
Our positive view was initially supported by the appearance of 5 Apr’s “Bullish Harami” and 6 Apr’s “Hammer” patterns, which were at the index’s 2-year lows. In addition, we also detected significant “Double Bottom” and “Positive Divergence” reversal patterns this month, which suggests the recent correction during Jan-Mar 2018 was at the limit of the retracement. Technically speaking, the FBMSC is in the process of shifting towards the upside from being in the downside previously.
Our immediate support stays at 14,389 pts, which was the low of 26 Apr’s “Bullish Harami” pattern. If this level is taken out, the following support is pegged at the 13,719-pt mark, or the low of 5 Apr’s “Bullish Harami” pattern. Conversely, the immediate resistance is at 15,188 pts, which is located at 17 Apr’s high. This is followed by the 15,857-pt resistance mark, or the low of 6 Feb’s “Hammer” pattern.
Source: RHB Securities Research - 12 Jun 2018
More articles on RHB Retail Research
Duopharma Biotech - Lacking Near-Term Re-Rating Catalysts; D/G NEUTRAL
Created by rhboskres | Aug 26, 2024
Discussions
Be the first to like this. Showing 0 of 0 comments
Post a Comment
Featured Posts


Latest Videos


Apps


Top Articles
1
THE INVESTMENT APPROACH OF CALVIN TAN
2
Koon Yew Yin's Blog
3
save malaysia!
5
6
7
8
Mercury Securities Research
#
Stock
Score
Daily Stocks
Stock Name
Last
Change
Volume
Stock Name
Last
Change
Volume
MQ Trading Signals
Stock
Time
Signal
Duration
Stock
Time
Signal
Duration
Featured Advertisers / Partners


Ride The Bull Short The Bear
CS Tan
4.9 / 5.0
This book is the result of the author's many years of experience and observation throughout his 26 years in the stockbroking industry. It was written for general public to learn to invest based on facts and not on fantasies or hearsay....