


RHB Retail Research
FBM Small Cap Index - The Bullish Bias Resume

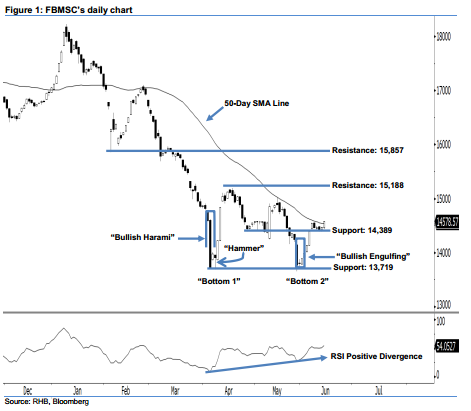
Expect more upside follow-throughs above the 50-day SMA line. The FBMSC ended at 14,578.57 pts last Thursday and posted a 109.34-pt increase. A white candle that breached above the 50-day SMA line was formed, which implied the session was led by the bulls. Note that we saw a positive continuation of the bullish bias in January after the index successfully breached above the 50-day SMA line. Using this historical upside movement as a leading indicator, we think more bullish follow-throughs will occur in the coming sessions.
As we see it, the FBMSC is in the process of changing direction – from a downside trend towards the upside. The earliest bullish signals were detected when 5 Apr’s “Bullish Harami” and 6 Apr’s “Hammer” patters appeared at the FBMSC’s 2-year low. Our upside view is also supported by this month’s significant “Double Bottom” and “Bullish Divergence” patterns – an indication that the bulls are taking control of market sentiment from the bears.
We keep the immediate support at 14,389 pts, which is located at the low of 26 Apr’s “Bullish Harami” pattern. This is followed by the 13,719-pt support, or the low of 5 Apr’s “Bullish Harami” pattern. On the flip side, our immediate resistance is set at 15,188 pts, which was the high of 17 Apr. This is followed by the next resistance at 15,857 pts, or the low of 6 Feb’s “Hammer” pattern.
Source: RHB Securities Research - 18 Jun 2018
More articles on RHB Retail Research
Duopharma Biotech - Lacking Near-Term Re-Rating Catalysts; D/G NEUTRAL
Created by rhboskres | Aug 26, 2024
Discussions
Be the first to like this. Showing 0 of 0 comments
Post a Comment
Featured Posts


Latest Videos


Apps


Top Articles
1
2
3
Koon Yew Yin's Blog
4
THE INVESTMENT APPROACH OF CALVIN TAN
5
save malaysia!
7
8
CEO Morning Brief
#
Stock
Score
Daily Stocks
Stock Name
Last
Change
Volume
Stock Name
Last
Change
Volume
Stock Name
Last
Change
Volume
MQ Trading Signals
Stock
Time
Signal
Duration
Stock
Time
Signal
Duration
Featured Advertisers / Partners


Ride The Bull Short The Bear
CS Tan
4.9 / 5.0
This book is the result of the author's many years of experience and observation throughout his 26 years in the stockbroking industry. It was written for general public to learn to invest based on facts and not on fantasies or hearsay....