


RHB Retail Research
FBM Small Cap Index - Ongoing Upside Moves

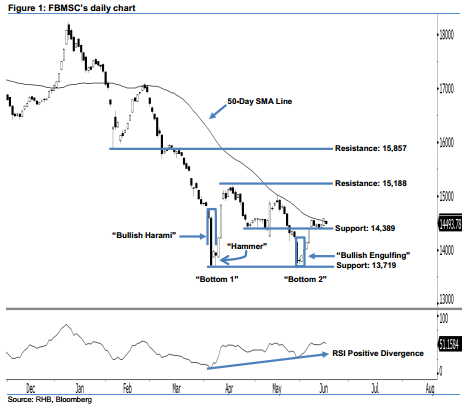
Positive expectation remains intact above 13,719 pts. The FBMSC ended yesterday’s session at 14,493.78 pts and registered an 84.79-pt loss. Despite the decrease, this does not negate the market’s 2-month bullish bias. From our technical viewpoint, the index is merely taking a normal breather after successfully breaching above the 50-day SMA line on 14 Jun. As long as the FBMSC is able to hover above the 13,719-pt mark, we believe the bulls are dominating market sentiment.
Overall, the ongoing upside movement is still in play and likely to extend further. For the record, the appearance of 5 Apr’s “Bullish Harami” and 6 Apr’s “Hammer” patterns at the index’s 2-year low were the earliest signals that market strength was accumulating. Our positive view is also supported by this month’s important “Double Bottom” and “Bullish Divergence” patterns. All these positive indicators imply that the trend is shifting from the downside towards the upside.
The immediate support stays at 14,389 pts, which was the low of 26 Apr’s “Bullish Harami” pattern. If this level is taken out, the next support is found at 13,719 pts, or the low of 5 Apr’s “Bullish Harami” pattern. Conversely, we set the immediate resistance at 15,188 pts, which is located at 17 Apr’s high. Our next resistance is pegged at 15,857 pts – this is located at the low of 6 Feb’s “Hammer” pattern.
Source: RHB Securities Research - 19 Jun 2018
More articles on RHB Retail Research
Duopharma Biotech - Lacking Near-Term Re-Rating Catalysts; D/G NEUTRAL
Created by rhboskres | Aug 26, 2024
Discussions
Be the first to like this. Showing 0 of 0 comments
Post a Comment
Featured Posts
Introducing MY's First IPO Fund for Sophisticated Investors!
New Update. Discover investment communities that resonate with your ideas
M & A Value Partners IPO Equity Fund has been launched - Targeted 13% Return p.a
Latest Videos


Apps


Top Articles
1
2
3
Koon Yew Yin's Blog
4
THE INVESTMENT APPROACH OF CALVIN TAN
5
save malaysia!
7
8
CEO Morning Brief
#
Stock
Score
Daily Stocks
Stock Name
Last
Change
Volume
Stock Name
Last
Change
Volume
Stock Name
Last
Change
Volume
MQ Trading Signals
Stock
Time
Signal
Duration
Stock
Time
Signal
Duration
Featured Advertisers / Partners


Ride The Bull Short The Bear
CS Tan
4.9 / 5.0
This book is the result of the author's many years of experience and observation throughout his 26 years in the stockbroking industry. It was written for general public to learn to invest based on facts and not on fantasies or hearsay....