FBM Small Cap Index - The Upside View Continues
rhboskres
Publish date: Tue, 26 Jun 2018, 09:26 AM

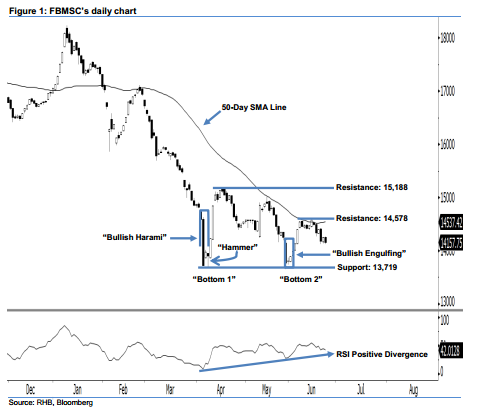
The positive view remains in play above the 13,719-pt mark. The FBMSC ended yesterday’s session at 14,157.75 pts, ie 96.16 pts lower from the prior close. A black candle was formed after the index oscillated between a low of 14,125.29 pts and high of 14,265.60 pts – an indication that there was no follow-through of the bullish bias we observed on 22 Jun. However, we make no change to our positive view, given that no strong downside development has been sighted yet. As the FBMSC continues to hover above the 13,719-pt mark, this implies that the more than 2-month bullish bias remains firmly in play.
Our positive view is also supported by this month’s significant “Double Bottom” and “Positive Divergence” bullish reversal patterns. These positive indicators suggest a change in trend towards the upside – from downside previously – may occur. Overall, market sentiment remains bullish.
Our immediate support is maintained at 13,719 pts, which was the low of 5 Apr’s “Bullish Harami” pattern. The following support is found at 13,116 pts, or the low of 25 Aug 2015. Towards the upside, the immediate resistance is seen at 14,578 pts, which is located at the high of 14 Jun. This is followed by the next resistance at 15,188 pts, ie the high of 17 Apr.
Source: RHB Securities Research - 26 Jun 2018
More articles on RHB Retail Research
Created by rhboskres | Aug 26, 2024


