


RHB Retail Research
Hang Seng Index Futures - Two-Year Uptrend Line Broken

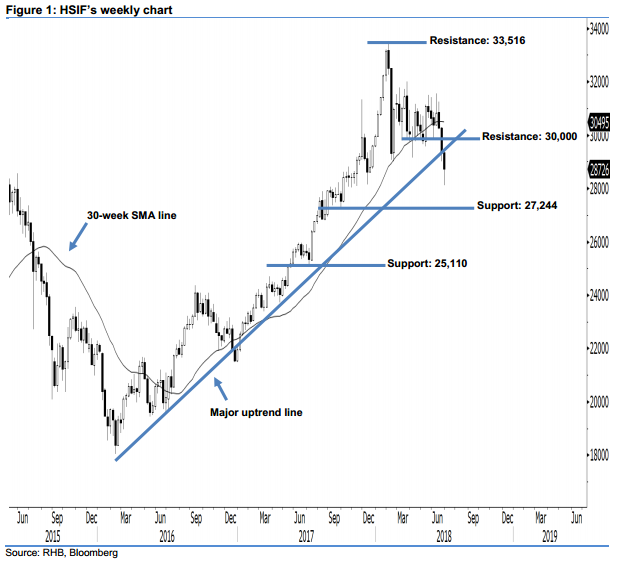
Market retracement will likely continue. Today, we analyse the HSIF’s longer-term trend based on its weekly chart. Last week, the HSIF formed a third consecutive week of black candle – an indication of persistent selling momentum. Last week’s lower close can be viewed as a continuation of the market retracement that started in early-Feb 2018. From a technical perspective, the market trend is considered negative, as the HSIF has marked a breakdown from the 2-year uptrend drawn in the chart. This also suggests that the bears may possibly be extending their downside momentum in the coming sessions.
As seen in the weekly chart, we anticipate the immediate resistance at the 30,000-pt psychological mark. If this level is taken out, the next resistance is seen at the 33,516-pt historical high. Towards the downside, we are eyeing the immediate support at 27,244 pts, ie the previous low of 29 Sep 2017. Meanwhile, the next support would likely be at 25,110 pts, determined from the low of 7 July 2017.
Overall, we advise traders to stick to short positions as signs of a significant rebound have not emerged yet. For more details, please refer to our 2 Jul 2018 report.
Source: RHB Securities Research - 3 Jul 2018
More articles on RHB Retail Research
Duopharma Biotech - Lacking Near-Term Re-Rating Catalysts; D/G NEUTRAL
Created by rhboskres | Aug 26, 2024
Discussions
Be the first to like this. Showing 0 of 0 comments
Post a Comment
Featured Posts
Introducing MY's First IPO Fund for Sophisticated Investors!
New Update. Discover investment communities that resonate with your ideas
M & A Value Partners IPO Equity Fund has been launched - Targeted 13% Return p.a
Latest Videos


Apps


Top Articles
1
2
3
Koon Yew Yin's Blog
4
THE INVESTMENT APPROACH OF CALVIN TAN
5
save malaysia!
7
8
CEO Morning Brief
#
Stock
Score
Daily Stocks
Stock Name
Last
Change
Volume
Stock Name
Last
Change
Volume
Stock Name
Last
Change
Volume
MQ Trading Signals
Stock
Time
Signal
Duration
Stock
Time
Signal
Duration
Featured Advertisers / Partners


Ride The Bull Short The Bear
CS Tan
4.9 / 5.0
This book is the result of the author's many years of experience and observation throughout his 26 years in the stockbroking industry. It was written for general public to learn to invest based on facts and not on fantasies or hearsay....