


RHB Retail Research
FBM Small Cap Index - Positive Expectations Ahead

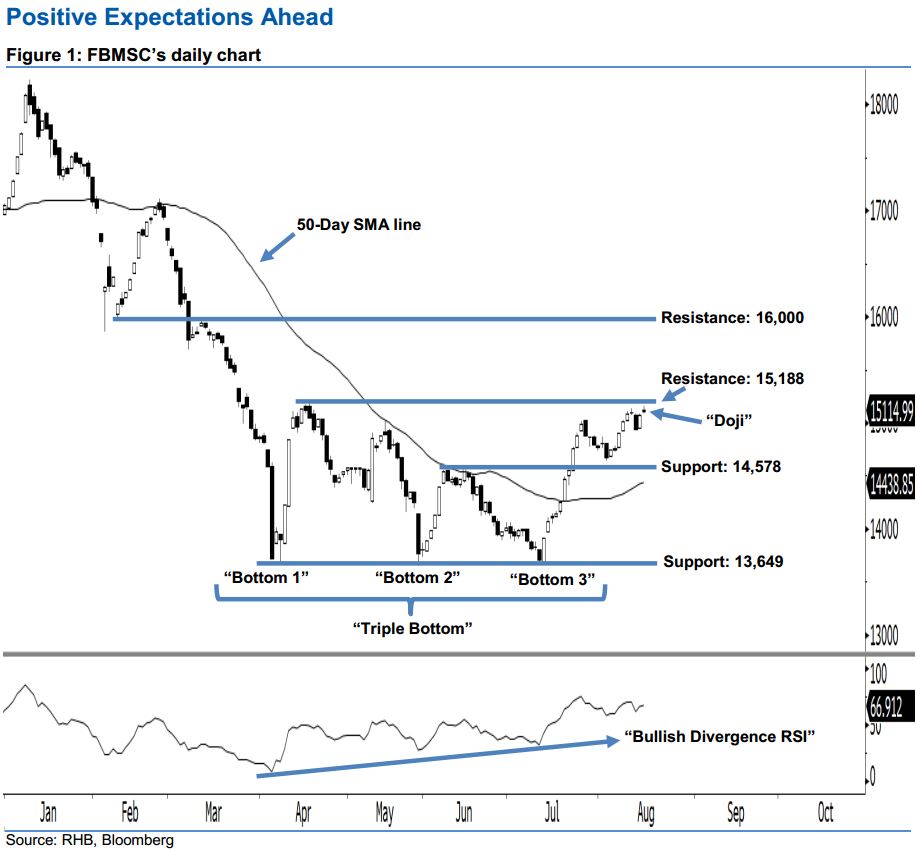
No end yet to the bullish bias of early April. The FBMSC inched up 46.94 pts yesterday to 15,114.99 pts. A “Doji” candlestick pattern was formed after the index hovered between a low of 15,079.57 pts and high of 15,157.64 pts – showing that neither bulls nor bears were able to take firm control at the end of the session. The FBMSC is now situated near the 15,188-pt resistance. Based on the current technical landscape, chances are high that the FBMSC may test this resistance in coming sessions. We note that the 50-day SMA line has also climbed by 46.94 pts to 15,114.99 pts, which implies a positive outlook and enhances our bullish view.
The bullish bias that started since early April remains in play. Initially, the appearance of 5 Apr’s “Bullish Harami” candlestick pattern was an early signal that the recent downtrend had reached its limit. This was also supported by last month’s “triple Bottom” and the “Bullish Divergence RSI” reversal patterns, which suggests the trend has moved towards the upside from the prior downside.
Our immediate support is maintained at 14,578 pts, which is located at the high of 14 Jun. The next support is pegged at 13,649 pts, or 30 May’s low. We set the immediate resistance at 15,188 pts, which was the high of 17 Apr. The following resistance is set at 16,000 pts – this is near the low and high of 9 Feb and 12 Mar.
Source: RHB Securities Research - 16 Aug 2018
More articles on RHB Retail Research
Duopharma Biotech - Lacking Near-Term Re-Rating Catalysts; D/G NEUTRAL
Created by rhboskres | Aug 26, 2024
Discussions
Be the first to like this. Showing 0 of 0 comments
Post a Comment
Featured Posts
Introducing MY's First IPO Fund for Sophisticated Investors!
New Update. Discover investment communities that resonate with your ideas
M & A Value Partners IPO Equity Fund has been launched - Targeted 13% Return p.a
Latest Videos


Apps


Top Articles
1
2
THE INVESTMENT APPROACH OF CALVIN TAN
3
4
save malaysia!
5
Koon Yew Yin's Blog
7
8
CEO Morning Brief
#
Stock
Score
Daily Stocks
Stock Name
Last
Change
Volume
Stock Name
Last
Change
Volume
Stock Name
Last
Change
Volume
MQ Trading Signals
Stock
Time
Signal
Duration
Stock
Time
Signal
Duration
Featured Advertisers / Partners


Ride The Bull Short The Bear
CS Tan
4.9 / 5.0
This book is the result of the author's many years of experience and observation throughout his 26 years in the stockbroking industry. It was written for general public to learn to invest based on facts and not on fantasies or hearsay....