FTSE Singapore Straits Times Index - Bullish Bias Persists
rhboskres
Publish date: Thu, 16 Aug 2018, 05:26 PM

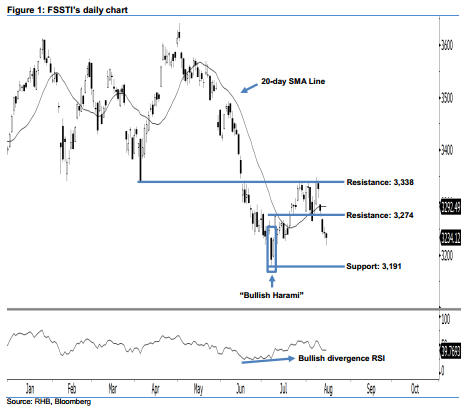
No end yet to the 5-week positive view. Yesterday’s session was led by the bears, as the FSSTI dipped 8.75 pts to close at 3,234.12 pts. As a result, a back candle was formed after the index oscillated between a low of 3,217.89 pts and high of 3,242.06 pts. Nevertheless, this does not change our 5-week positive view, as the FSSTI continues to hover above the 3,191-pt mark. As long as this level is not taken out, we believe that the bullish bias in the “Bullish Harami” candlestick pattern on 9 Jul has not been fully negated yet.
Overall, the current technical landscape suggests that the market sentiment remains with the bulls. At this juncture, this weak performance is viewed as the index merely taking a normal breather below 3,338 pts. Recall that we initially saw an encouraging upside development on July. This was also supported by the appearance of the “Bullish Divergence RSI” reversal pattern, suggesting that the trend has changed from downside to upside.
To the downside, our immediate support is pegged at 3,191 pts, or the low of 9 Jul’s “Bullish Harami” pattern. This is followed by the next support at the 3,113-pt mark, located at the low of 19 Apr 2017. Conversely, the immediate resistance is set at 3,274 pts, the high of 10 Jul. The next resistance is maintained at the 3,338-pt threshold, which was the low of 4 Apr.
Source: RHB Securities Research - 16 Aug 2018
More articles on RHB Retail Research
Created by rhboskres | Aug 26, 2024


