FBM Small Cap Index - Index May Still Go Up
rhboskres
Publish date: Fri, 17 Aug 2018, 09:43 AM

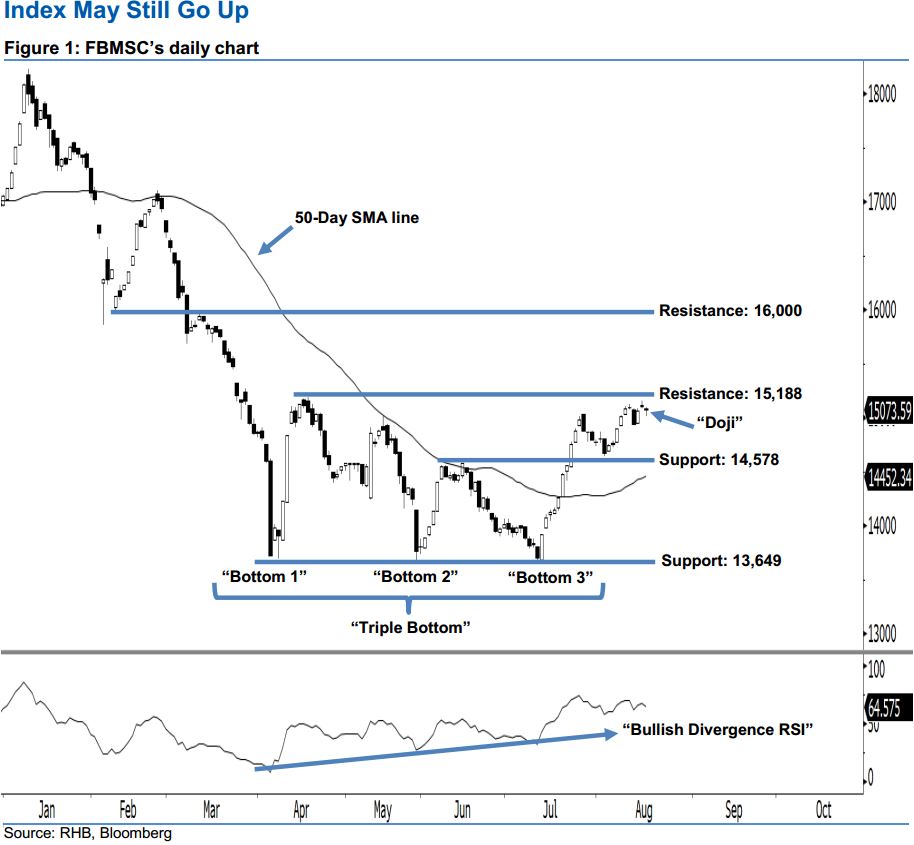
Positive expectation continues. At the end of yesterday’s session, the FBMSC registered a 41.40 pts loss to close at 15,073.59 pts. It left a “Doji” candlestick pattern after hovering between a low of 15,013.21 pts and high of 15,096.01 pts. This shows that both the bulls and bears were unable to take firm control at the end of the day. Overall, the 4-month bullish bias is still promising. Judging from the current technical landscape, chances are high that the upside movement may still be extended further. This is also supported by the fact that the index is hovering firmly above the 50-day SMA line, which points to a positive outlook.
We highlight two meaningful positive indicators, ie the “triple Bottom” and the “Bullish Divergence RSI” reversal patterns on last month. These suggest that the trend has changed towards the upside from downside. Hence, our upside view is enhanced.
The 14,578-pt mark, ie 14 Jun’s high, is maintained as our immediate support, followed by the next support at 13,649 pts, derived from the low of 30 May. On the flip side, we set the immediate resistance at 15,188 pts, located at the high of 17 Apr. In the event that this level is taken out, the next resistance is at16,000 pts, or near the low and high of 9 Feb and 12 Mar.
Source: RHB Securities Research - 17 Aug 2018
More articles on RHB Retail Research
Created by rhboskres | Aug 26, 2024


