FBM Small Cap Index - Upside Movement Still in Play
rhboskres
Publish date: Mon, 27 Aug 2018, 08:47 AM

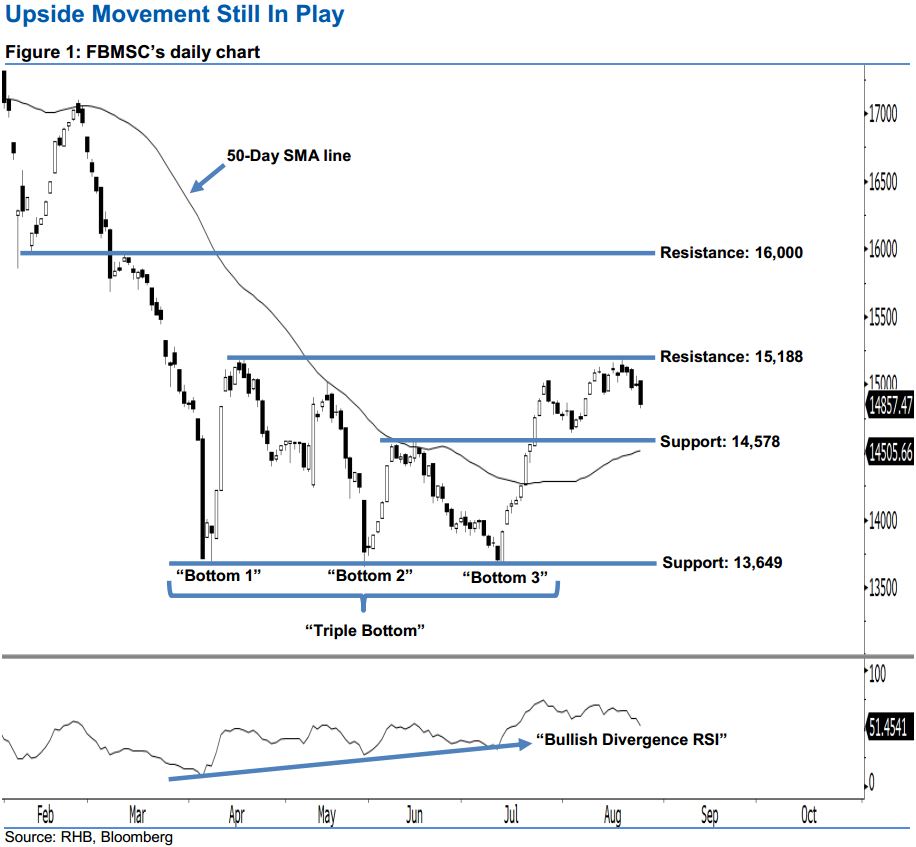
Positive view remains intact, as no strong downside development has been sighted. Last Friday’s session was led by the bears, as the FBMSC dropped 137.36 pts to 14,857.47 pts. As a result, a black candle was formed after the index oscillated between a low of 14,819.42 pts and high of 15,026 pts. Nonetheless, this decline carries no threat to our positive view, as no strong downside development has been sighted yet. Technically speaking, as long as the FBMSC is able to stay above the 13,649-pt threshold, we believe the bullish bias since early April remains in play.
Based on the current technical landscape, the upside movement could still extend once the breather below 15,188 pts ends. Our positive view is also supported by the significant “Triple Bottom” and “Bullish Divergence RSI” reversal patterns, suggesting that the trend has shifted towards the upside from downside.
To the downside, the immediate support is at 14,578 pts, ie the high of 14 Jun. This is followed by the next support at the 13,649-pt critical mark, which was 30 May’s low. Conversely, we set the immediate resistance at 15,188 pts, or the high of 17 Apr. This is followed by the next resistance at 16,000 pts, which is near the low and high of 9 Feb and 12 Mar.
Source: RHB Securities Research - 27 Aug 2018
More articles on RHB Retail Research
Created by rhboskres | Aug 26, 2024


