FTSE Singapore Straits Times Index - Bulls Still Present
rhboskres
Publish date: Tue, 28 Aug 2018, 11:06 AM

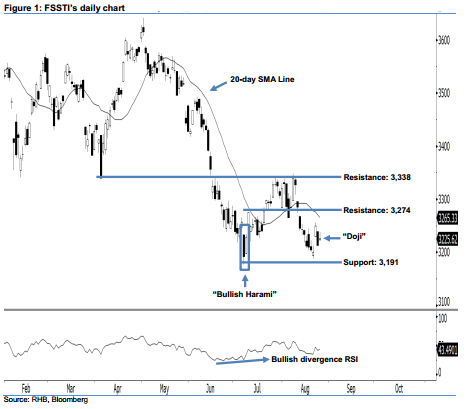
Positive view continues in line with the ongoing bullish bias. On Monday, the FSSTI registered a 12.62-pt increase to 3,225.62 pts. It formed a “Doji” candlestick pattern after oscillating between a low of 3,222.12 pts and high of 3,237.66 pts. This shows that neither the bulls nor bears were able to take firm control of the session at the end of the day. Presently, we see the index continuing to hover steadily above the 3,191-pt support. From our technical perspective, the bullish bias since the appearance of the “Bullish Harami” candlestick pattern on 9 Jul, remains in play.
In addition to the abovementioned bullish pattern, we also highlight last month’s “Bullish Divergence RSI” reversal pattern. This suggests that the trend has shifted from downside towards the upside, thereby enhancing our positive view. Overall, the bulls are still present.
We maintain the immediate support at 3,191 pts, derived from the low of 9 Jul’s “Bullish Harami” pattern. This is followed by the next support at the 3,113-pt mark, or the low of 19 Apr 2017. On the flip side, the immediate resistance is pegged at 3,274 pts, which was the high of 10 Jul. The next resistance is set at the 3,338-pt threshold, locate at 4 Apr’s low.
Source: RHB Securities Research - 28 Aug 2018
More articles on RHB Retail Research
Created by rhboskres | Aug 26, 2024


