E-mini Dow Futures: Long-Term Prospects Are Positive
rhboskres
Publish date: Tue, 04 Sep 2018, 03:03 PM

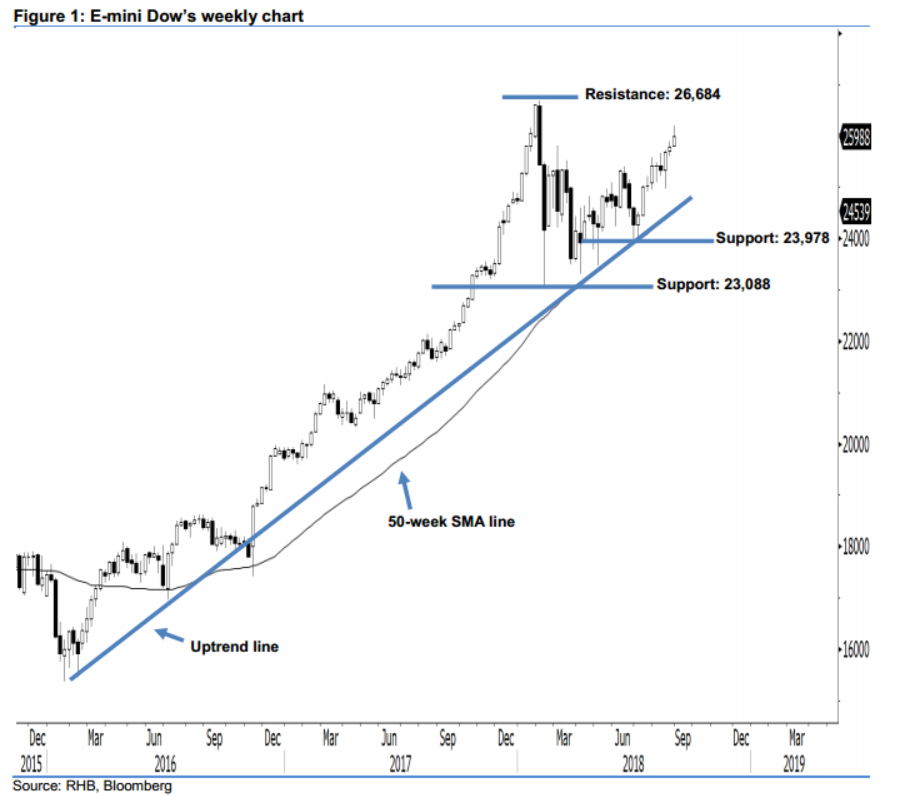
Long-term bullish trend unchanged. Today, we analyse the E-mini Dow’s longer-term trend. As seen in the weekly chart, it formed another white candle for the third consecutive week, indicating the presence of buying momentum. The upside strength has continued as expected, as the index has held above the rising 50-week SMA line for more than two years. Presently, the market trend is considered bullish, as the E-mini Dow has marked a higher close above the 2-year uptrend line drawn in the weekly chart. This also suggests that bulls may possibly be extending the rebound that started from early Jul 2018.
According to the weekly chart, we are eyeing the immediate support at 23,978 pts, obtained from the previous low of 6 Jul. The next support is seen at 23,088 pts, determined from the low of 9 Feb. Towards the upside, the nearterm resistance is anticipated at the 26,684 pts historical high. This is followed by the 27,000-pt psychological spot.
Overall, based on our analysis of the daily chart, we advise traders to stick to long positions. This is because signs of a significant reversal have not emerged. For more details, please refer to our 3 Sep report.
Source: RHB Securities Research - 4 Sept 2018
More articles on RHB Retail Research
Created by rhboskres | Aug 26, 2024


