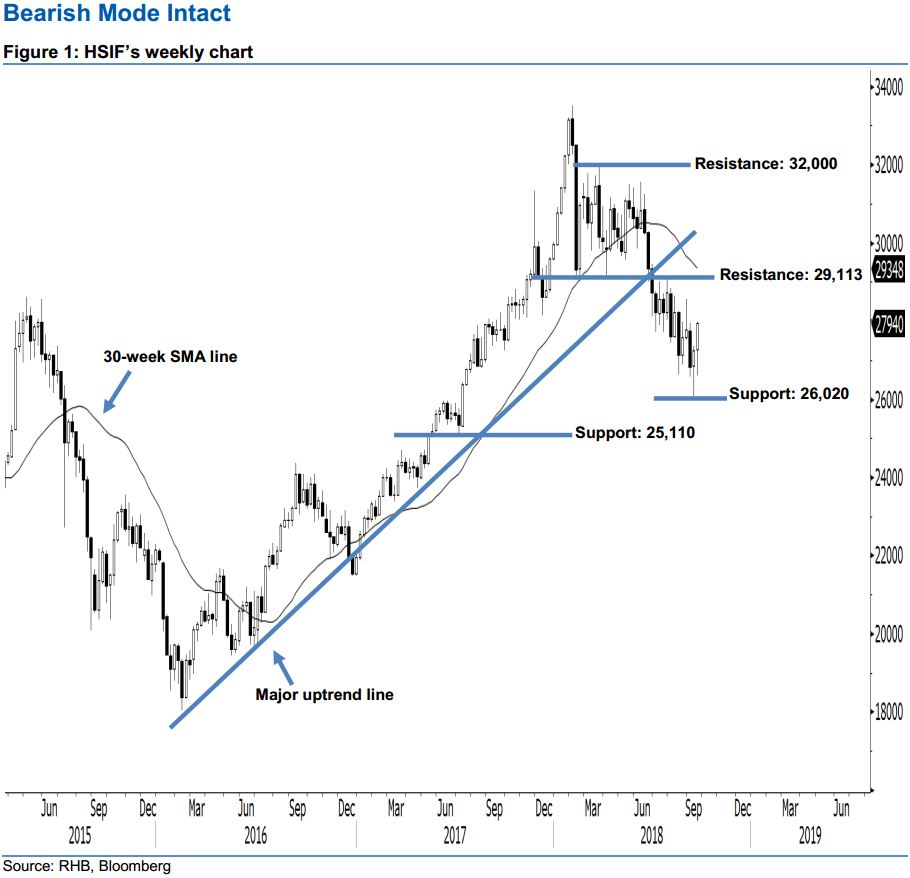
Hang Seng Index Futures - Bearish Mode Intact
rhboskres
Publish date: Wed, 26 Sep 2018, 05:05 PM

Longer-term outlook is still bearish. Today, we analyse the HSIF’s longer-term trend based on its weekly chart. Last week, it ended higher to form another white candle, indicating that the recent selling momentum may be slowing down. However, we think the market trend is still considered bearish in the longer term, given that the index is now trading below the 30-week SMA line. To recap, the HSIF marked a decisive breakdown from the major uptrend line drawn in the chart in late June, which implied that the sellers were possibly expanding their selling momentum in the coming sessions. Thus, on a technical basis, last week’s white candle can be considered merely as a technical rebound after the breakdown from the aforementioned uptrend line.
Based on the weekly chart, we are eyeing the immediate resistance level at 29,113 pts, determined from the 26 Jul high. The next resistance would likely be at the 32,000-pt psychological mark. To the downside, the immediate support level is seen at 26,020 pts, situated at the low of 12 Sep. Meanwhile, the next support is anticipated at 25,110 pts, obtained from the previous low of 5 Jul 2017.
Yet, based on our analysis of the daily chart, we advise traders to maintain long positions. This is because the market is still holding above the 27,294-pt support level. For more details, please refer to our 25 Sep report.
Source: RHB Securities Research - 26 Sept 2018
More articles on RHB Retail Research
Created by rhboskres | Aug 26, 2024


