Hang Seng Index Futures - Bullish Short-Term Prospects
rhboskres
Publish date: Fri, 28 Sep 2018, 04:30 PM

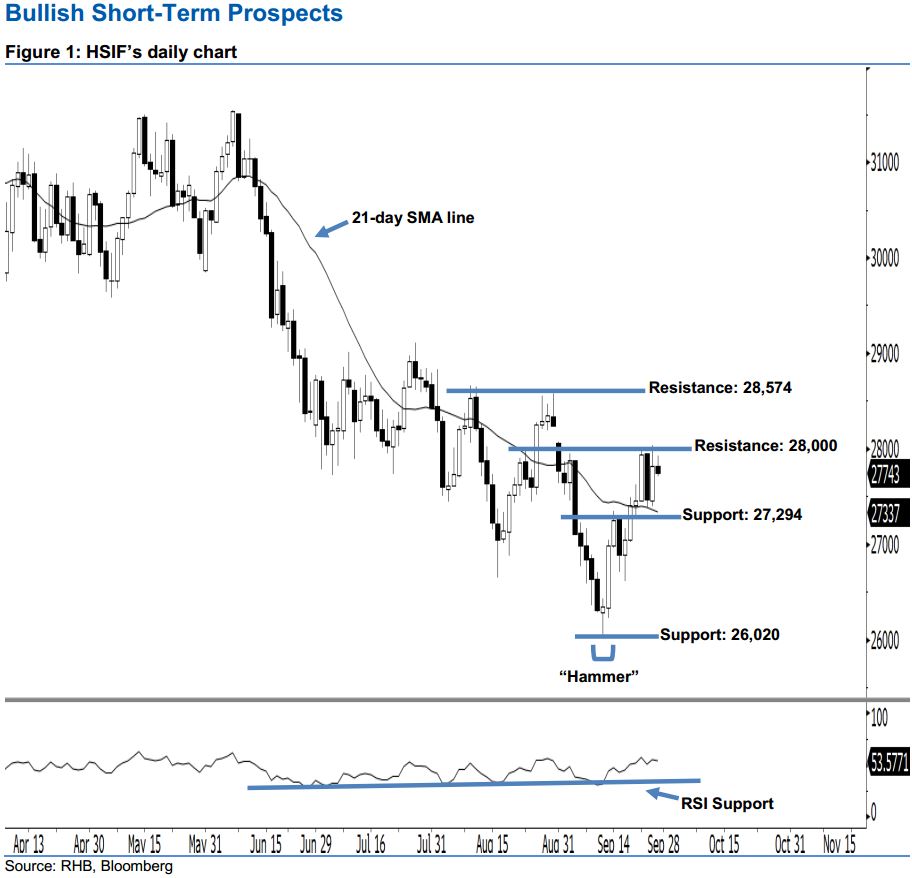
Stay long. The HSIF ended lower to form a black candle yesterday. It settled at 27,743 pts, off its high of 27,929 pts and low of 27,710 pts. However, the appearance of yesterday’s black candle merely indicates that buyers may be taking a breather after recent gains. As the index is still holding above the 21-day SMA line, this indicates that the near term bullish sentiment stays intact. Furthermore, the 14-day RSI indicator is now recovering to a more positive reading of 53.57 pts – this suggests that the bullish sentiment has been enhanced.
Based on the daily chart, the immediate support is seen at 27,294 pts, ie the low of 20 Sep. If this level is taken out, look to 26,020 pts – obtained from the low of 12 Sep’s “Hammer” pattern – as the next support. Towards the upside, we maintain the near term resistance at the 28,000-pt psychological mark. This is followed by 28,574 pts, defined from the high of 30 Aug.
Hence, we advise traders to maintain long positions, given that we initially recommended initiating long above the 26,700-pt level on 14 Sep. At the same time, a trailing-stop can be set below the 27,294-pt threshold in order to secure part of the profits.
Source: RHB Securities Research - 28 Sept 2018
More articles on RHB Retail Research
Created by rhboskres | Aug 26, 2024


