Hang Seng Index Futures - Prospects Are Bearish
rhboskres
Publish date: Thu, 18 Oct 2018, 04:16 PM

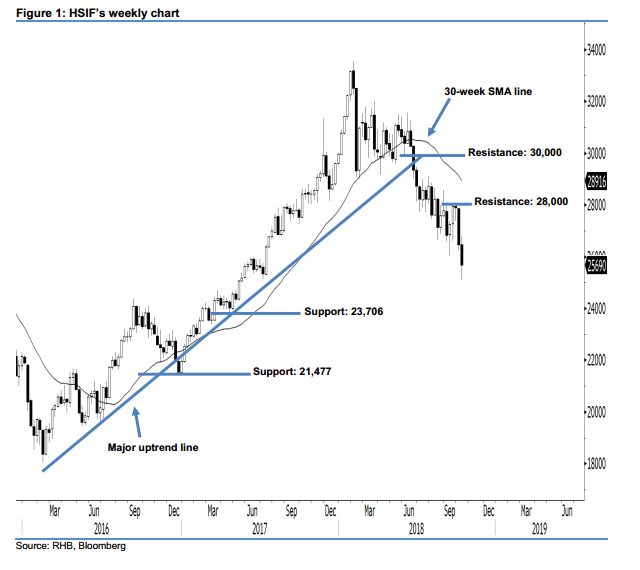
Market retracement will likely continue. Today, we analyse the HSIF’s longer-term trend based on its weekly chart. Last week, the HSIF formed a second consecutive week of black candle, which suggests persistent selling momentum. Last week’s black candle can be viewed as a continuation of the market retracement that started in early Feb 2018. On a technical basis, the market trend is considered bearish, as the HSIF has recently marked a decisive breakdown from the 2-year uptrend drawn in the chart. This also implies that the bears may possibly be extending their downside momentum in the coming sessions.
According to the weekly chart, we are eyeing the immediate resistance level at the 28,000-pt round figure, also set near the high of 28 Sep. The next resistance is seen at the 30,000-pt psychological mark. To the downside, the immediate support level is anticipated at 23,706 pts, ie the previous low of 21 Apr 2017. Meanwhile, the next support is situated at 21,477 pts, determined from the low of 23 Dec 2016.
Overall, we advise traders to stick to short positions as signs of a significant rebound have not emerged yet. For more details, please refer to our 17 Oct 2018 report.
Source: RHB Securities Research - 18 Oct 2018
More articles on RHB Retail Research
Created by rhboskres | Aug 26, 2024


