E-mini Dow Futures - the Rally Continues
rhboskres
Publish date: Mon, 18 Feb 2019, 04:18 PM

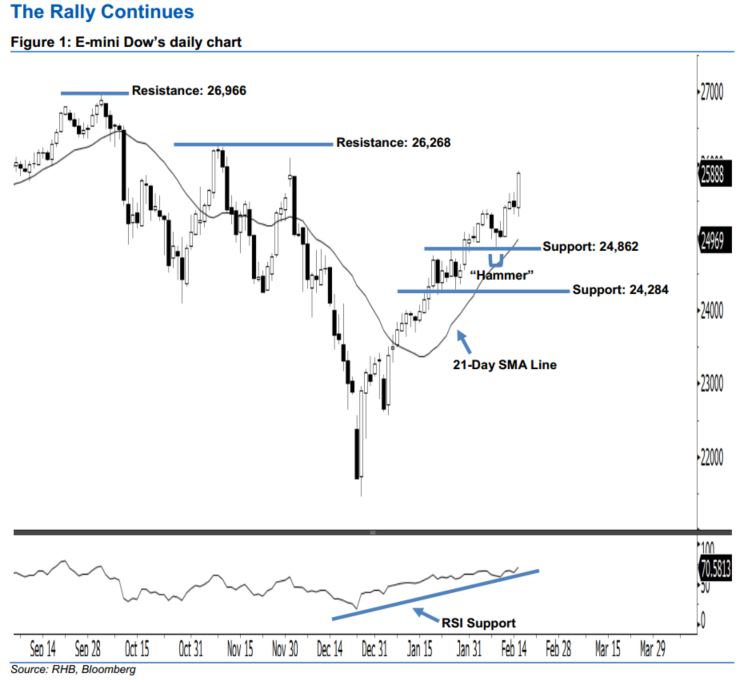
Stay long, with a new trailing-stop set below the 24,862-pt level. The E-mini Dow formed a long white candle last Friday, indicating that the buying momentum could be strong. It surged 461 pts to close at 25,888 pts, off the session’s low of 25,275 pts and high of 25,907 pts. Based on the current outlook, last Friday’s long white candle has marked a higher close above the rising 21-day SMA line and hit the highest point in more than two months – this indicates the buying momentum has been extended. Overall, we think the upside swing, which began with 8 Feb’s “Hammer” pattern, may persist.
Based on the daily chart, we are now eyeing the immediate support at 24,862 pts – this was determined from the low of 8 Feb’s “Hammer” pattern. The next support is seen at 24,284 pts, ie near the lows of 23 and 28 Jan. On the other hand, we now anticipate the immediate resistance at 26,268 pts, which is situated at the high of 8 Nov 2018. If the price breaks out, the next resistance is maintained at the 26,966-pt historical high.
Recall that on 27 Dec 2018 we initially recommended traders to initiate long positions above the 22,400-pt level. We continue to advise them to stay long for now while setting a new trailing-stop below the 24,862-pt threshold. This is to lock in a larger part of the profits.
Source: RHB Securities Research - 18 Feb 2019
More articles on RHB Retail Research
Created by rhboskres | Aug 26, 2024


