COMEX Gold - Looking Positive
rhboskres
Publish date: Tue, 19 Feb 2019, 09:19 AM

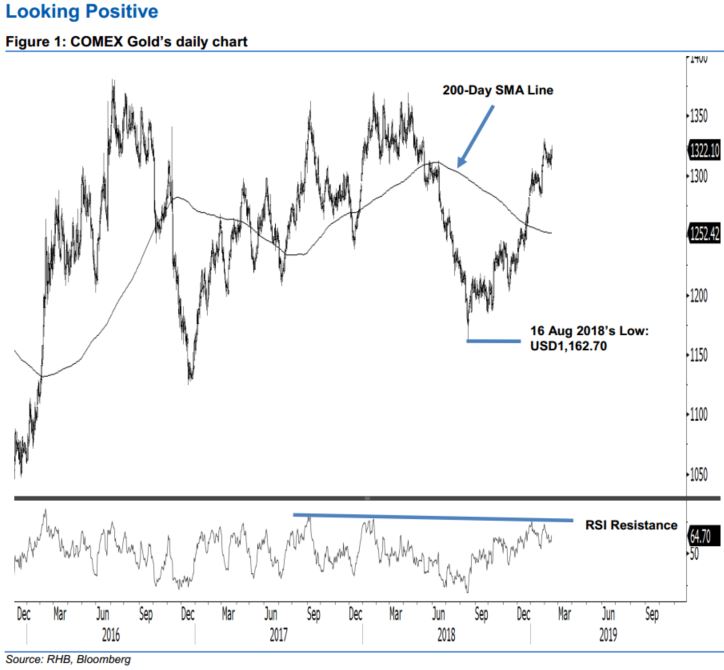
Maintain long positions, as the upward move is still progressing. Today we look at the COMEX Gold’s multiyear chart to analyse its long-term price trends. Overall, the commodity has been trading in a sideways pattern since reaching a high of USD1,380.90 on 6 Jul 2016. We observed that the COMEX Gold’s price has been on the upward move, starting from the low of USD1,162.70 on 16 Aug 2018. While the rally has been relatively sharp and only just failed to break above the Daily RSI resistance line recently (as drawn in the chart) – suggesting the momentum may be waning – without price actions to suggest a deeper retracement is in the making, we stick to our positive trading bias.
As there are no signals to suggest that the commodity’s upward move has reached an end, we continue to advise traders to stay in long positions. We initiated this at the USD1,216 level, which was 14 Nov 2018’s close. For riskmanagement purposes, a stop-loss can be placed below the USD1,306.40 mark.
The immediate support target is set at USD1,306.40, which was the low of 7 Feb. This is followed by USD1,281.50, or the low of 24 Jan. Moving up, the immediate resistance is set at USD1,332.40, ie the high of 11 May 2018. This is followed by the USD1,370.50 level, which was the high of 25 Jan 2018.
Source: RHB Securities Research - 19 Feb 2019
More articles on RHB Retail Research
Created by rhboskres | Aug 26, 2024


