RHB Retail Research
Trading Stocks- VisDynamics Holdings
rhboskres
Publish date: Fri, 26 Jun 2020, 07:33 PM

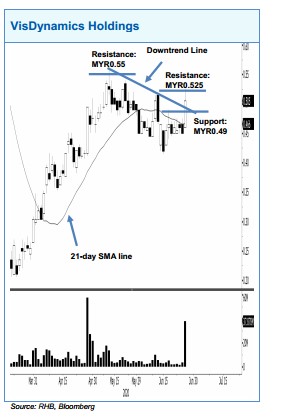
VisDynamics formed a white candle to breach above the 21- day SMA line and the multi-week downtrend line. A positive bias may emerge above MYR049 with the following resistance eyed at MYR0.525, followed by MYR0.55. A stop-loss can be placed below MYR0.49.
Source: RHB Securities Research - 30 Jun 2020
Related Stocks
| Chart | Stock Name | Last | Change | Volume |
|---|
More articles on RHB Retail Research
Duopharma Biotech - Lacking Near-Term Re-Rating Catalysts; D/G NEUTRAL
Created by rhboskres | Aug 26, 2024
Discussions
Be the first to like this. Showing 0 of 0 comments


