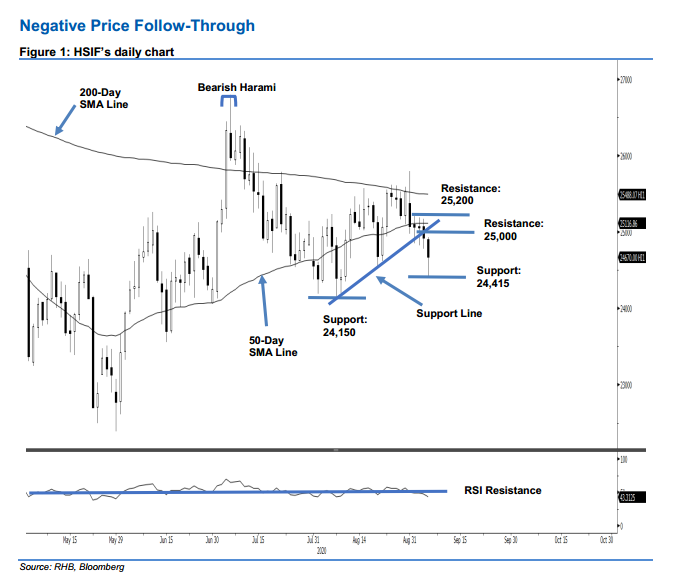
Hang Seng Index Futures - Negative Price Follow-Through
rhboskres
Publish date: Mon, 07 Sep 2020, 12:22 PM

Breakdown from the support levels; initiate short positions. The HSIF has extended its retracement following the recent breakdown from the 50-day SMA and short-term support lines (as drawn in the chart). It ended the latest trade 254 pts lower at 24,670 pts, after earlier falling to 24,415 pts. The current retracement phase started after the index failed in its attempt to cross above the 200-day SMA line on 31 Aug. Based on the daily chart, this negative bias should stay as long as the HSIF remains capped by the 25,200-pt resistance.
Our previous long positions were initiated at 25,235 pts, ie the closing level of 12 Aug was closed out at 25,000 pts on 3 Sep. Concurrently, we initiated short positions. For risk-management purposes, a stop-loss can be placed above the 25,200-pt level.
The immediate support is revised to 24,415 pts, ie the latest low. This is followed by 24,150 pts, which was the low of 7 Aug. Conversely, the immediate resistance is eyed at the 25,000-pt round figure, and followed by 25,200-pts – near the highs of 1-4 Sep
Source: RHB Securities Research - 7 Sept 2020
More articles on RHB Retail Research
Created by rhboskres | Aug 26, 2024


