RHB Retail Research
Trading Stocks - AHB Holdings
rhboskres
Publish date: Tue, 06 Oct 2020, 11:52 AM

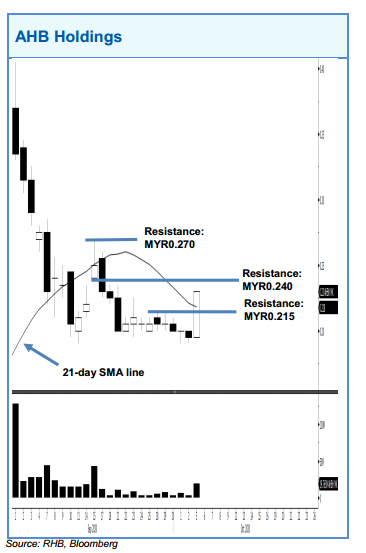
AHB formed a white candle to cross above the MYR0.215 resistance and 21-day SMA line on improved volume profile. This signals a possible positive price reversal. A positive bias may appear above MYR0.215 with resistance points pegged at MYR0.24 and MYR0.27. A downside breach of MYR0.215 would cancel this expectation.
Source: RHB Securities Research - 6 Oct 2020
Related Stocks
| Chart | Stock Name | Last | Change | Volume |
|---|
Market Buzz
More articles on RHB Retail Research
Duopharma Biotech - Lacking Near-Term Re-Rating Catalysts; D/G NEUTRAL
Created by rhboskres | Aug 26, 2024
Discussions
Be the first to like this. Showing 0 of 0 comments


