RHB Retail Research
Trading Stocks - RGT
rhboskres
Publish date: Tue, 26 Jan 2021, 02:47 PM

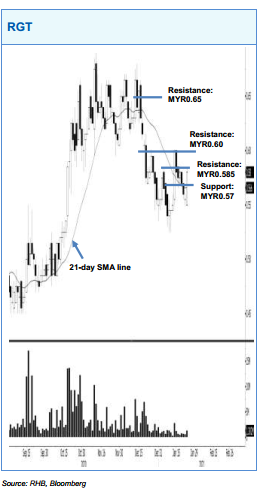
RGT’s 1-week correction in the form of a retracement may have reached an end in the latest session, as the stock formed a white candle to cross above the 21-day SMA line. A positive bias may appear above MYR0.585, with subsequent resistance levels marked at MYR0.60 and MYR0.65. This bias would be cancelled if the MYR0.57 support is breached.
Source: RHB Securities Research - 26 Jan 2021
Related Stocks
| Chart | Stock Name | Last | Change | Volume |
|---|
More articles on RHB Retail Research
Duopharma Biotech - Lacking Near-Term Re-Rating Catalysts; D/G NEUTRAL
Created by rhboskres | Aug 26, 2024
Discussions
Be the first to like this. Showing 0 of 0 comments


