RHB Retail Research
Trading Stocks - CEKD
rhboskres
Publish date: Fri, 05 Nov 2021, 04:54 PM

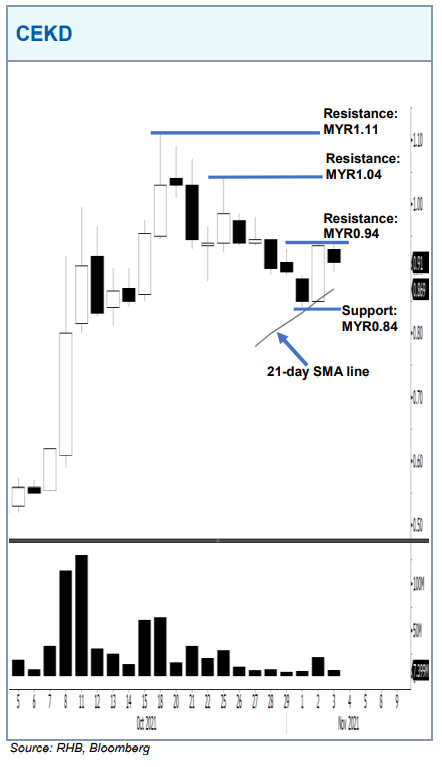
CEKD is in the process of consolidating sideways after undergoing a recent retracement. The bullish bias may emerge if a breakout happens above the MYR0.94 level – forming a “higher high” bullish pattern. If that happens, the bullish momentum may lead to the resistance level of MYR1.04 before possibly hitting the MYR1.11 historical high. However, falling below the MYR0.84 support may see the stock descending further to mark a “lower low” bearish pattern.
Source: RHB Securities Research - 5 Nov 2021
Related Stocks
| Chart | Stock Name | Last | Change | Volume |
|---|
Market Buzz
More articles on RHB Retail Research
Duopharma Biotech - Lacking Near-Term Re-Rating Catalysts; D/G NEUTRAL
Created by rhboskres | Aug 26, 2024
Discussions
Be the first to like this. Showing 0 of 0 comments


