Hang Seng Index Futures: Medium-Term Trend Remains Weak
rhboskres
Publish date: Thu, 03 Feb 2022, 06:08 PM

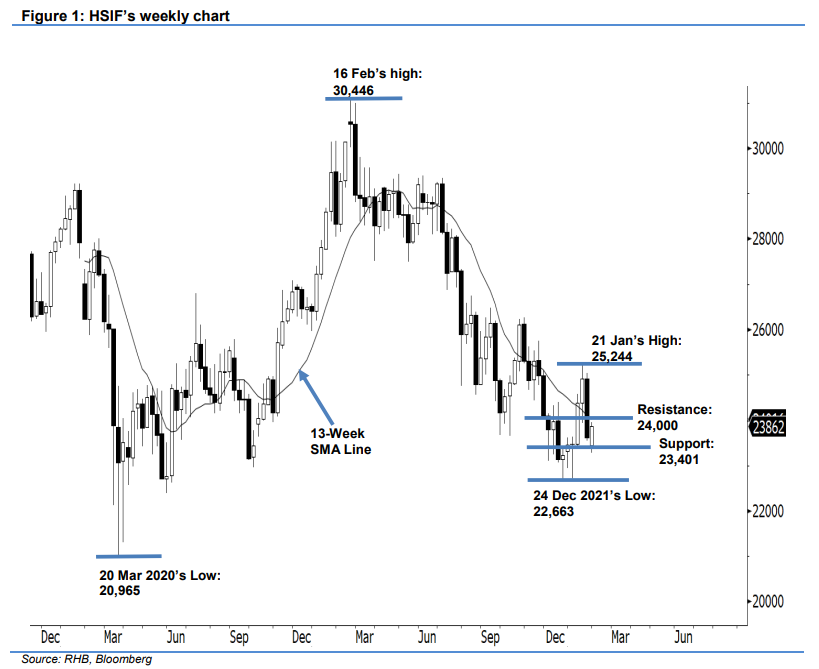
Maintain short positions. Based on the weekly chart, the HSIF printed a bullish candlestick and settled at 23,862 pts. Since finding its bottom at 22,663 pts on 20 Dec 2021, the index has attempted to stage a rebound, recording its recent high of 25,244 pts on 21 Jan. However, it has failed to retain its position lately, slipping below the 13-week SMA line. We observe that the medium-term moving average line is pointing downwards, suggesting that the medium-term trend will be on a downward trajectory. If the index manages to cross above the moving average line again, or break past the 24,000-pt resistance, there is a possibility that the correction will come to an end. Otherwise, the index may track the moving average line and trend lower. In this scenario, selling pressure could drag the index to retest the recent low of 22,663 pts. For now, we hold on to our negative trading bias until the stop-loss is breached.
We recommend traders maintain the short positions initiated at 23,840 pts or the closing of 27 Jan’s day session. To manage trading risks, the initial stop-loss is placed at 24,645 pts.
Based on the daily chart, the immediate support is marked at 23,401 pts (10 Jan’s low), followed by 23,000 pts. On the upside, the immediate resistance is eyed at the 24,000-pt psychological mark, and the higher hurdle at 24,645 pts or the high of 25 Jan.
Source: RHB Securities Research - 3 Feb 2022
More articles on RHB Retail Research
Created by rhboskres | Aug 26, 2024


