


Round & Surge Operator Analysis
Understanding Support and Resistance through Big Boys Demand and Supply

roundnsurge
Publish date: Wed, 09 Aug 2023, 04:25 PM
roundnsurge
0 59
"True trader react to the market" is the core of our Operator analysis. Operator Analysis analyze the price and volume of the big boys in equity market, where we currently using our analysis in gold market, Bitcoin and Malaysia market.
We will be sharing education material here such as to become a successful trader & investor, corporate action explanation, the financial instrument in the market you can utilize for your investment and more. We are here to help you understand the stock market.
We will be sharing education material here such as to become a successful trader & investor, corporate action explanation, the financial instrument in the market you can utilize for your investment and more. We are here to help you understand the stock market.
Introduction to Support and Resistance:
Support and resistance are crucial concepts in trading that help traders identify potential entry and exit points in the market. Traditionally, traders draw horizontal lines on charts to mark these key price levels. However, an alternative approach is to examine support and resistance levels based on the demand and supply dynamics of big players, often referred to as the "big boys" or "smart money." By understanding where these significant players are likely to enter or exit positions, traders can gain valuable insights for their own trading decisions.
The Big Boys and Their Influence:
Institutional players, such as hedge funds, mutual funds, and large financial institutions, wield substantial capital and have the ability to impact market movements significantly. Their decisions are based on extensive research, analysis, and insights, making them important market participants to watch closely. Understanding their actions can provide retail traders with a competitive advantage.
Market Dynamics of Demand and Supply:
At its core, the concept of support and resistance is driven by the interplay of demand and supply in the market. When demand for an asset increases, buyers are willing to step in at certain price levels, creating a support zone. Conversely, when supply exceeds demand, sellers become more active at specific price levels, leading to resistance zones.
Identifying Big Player Demand Zones (Support):
There are several ways to identify areas where institutional buying interest is likely to cluster, creating support levels:
Volume Analysis: Look for spikes in trading volume, especially during price declines, as this often indicates big players buying.
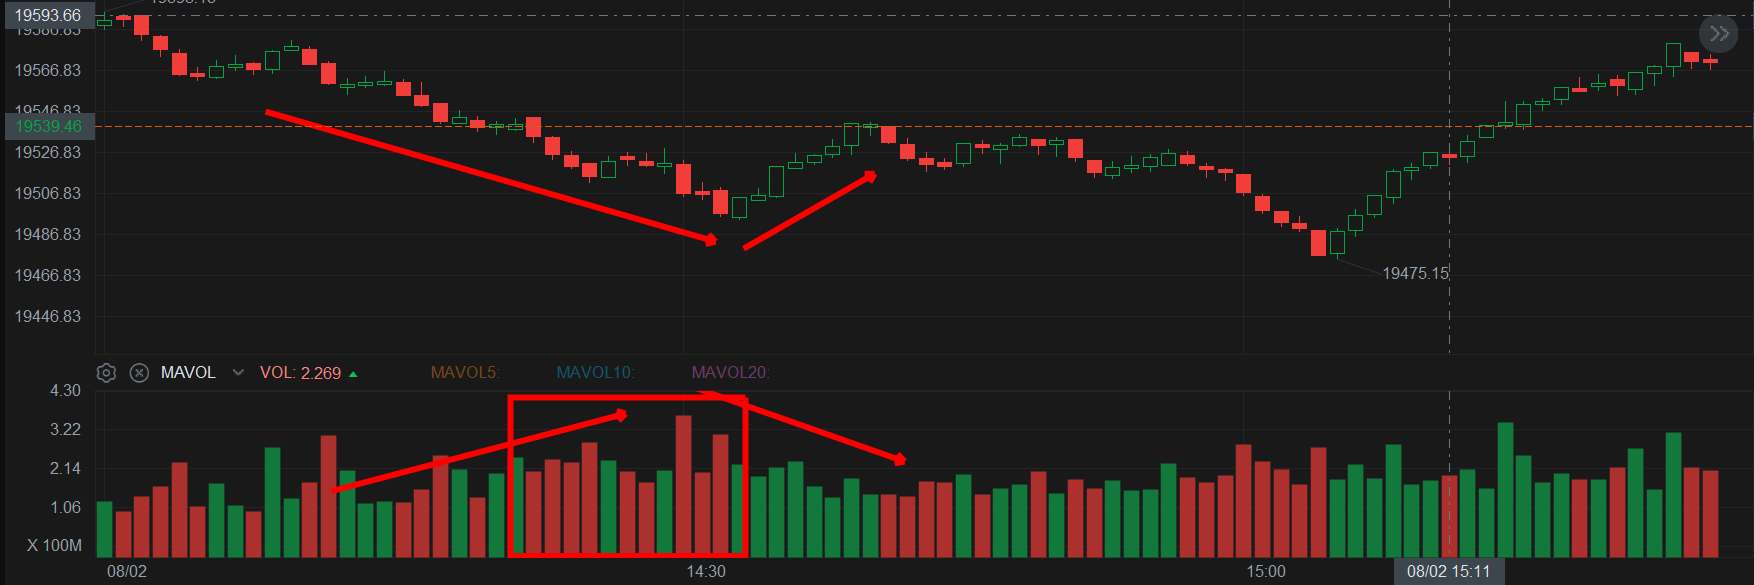
Identify selling pressure dry out: selling pressure will often dry out after some time, this can be identified with 2nd volume spike with price fall after the 1st volume. The volume is usually lower than the 1st volume. With the above, together with understanding the daily price range of the trading assets, it can give you higher probability to find the price bottom.
Key factor in demand is formed: Let’s assume the main demand & supply are created by the big players, retail investors like us don't affect the market price much. Big players often buy at the low with low volume to avoid retail investor’s attention, this can help them to accumulate more units of securities at the lower price. They will only create high volume at high prices for the purpose of attracting buyers.
Identifying Big Player Supply Zones (Resistance):
Big boys selling pressure can be spotted by analyzing the following factors:
High Selling Volume: Observe unusually high trading volume during price rallies, signaling potential institutional selling.
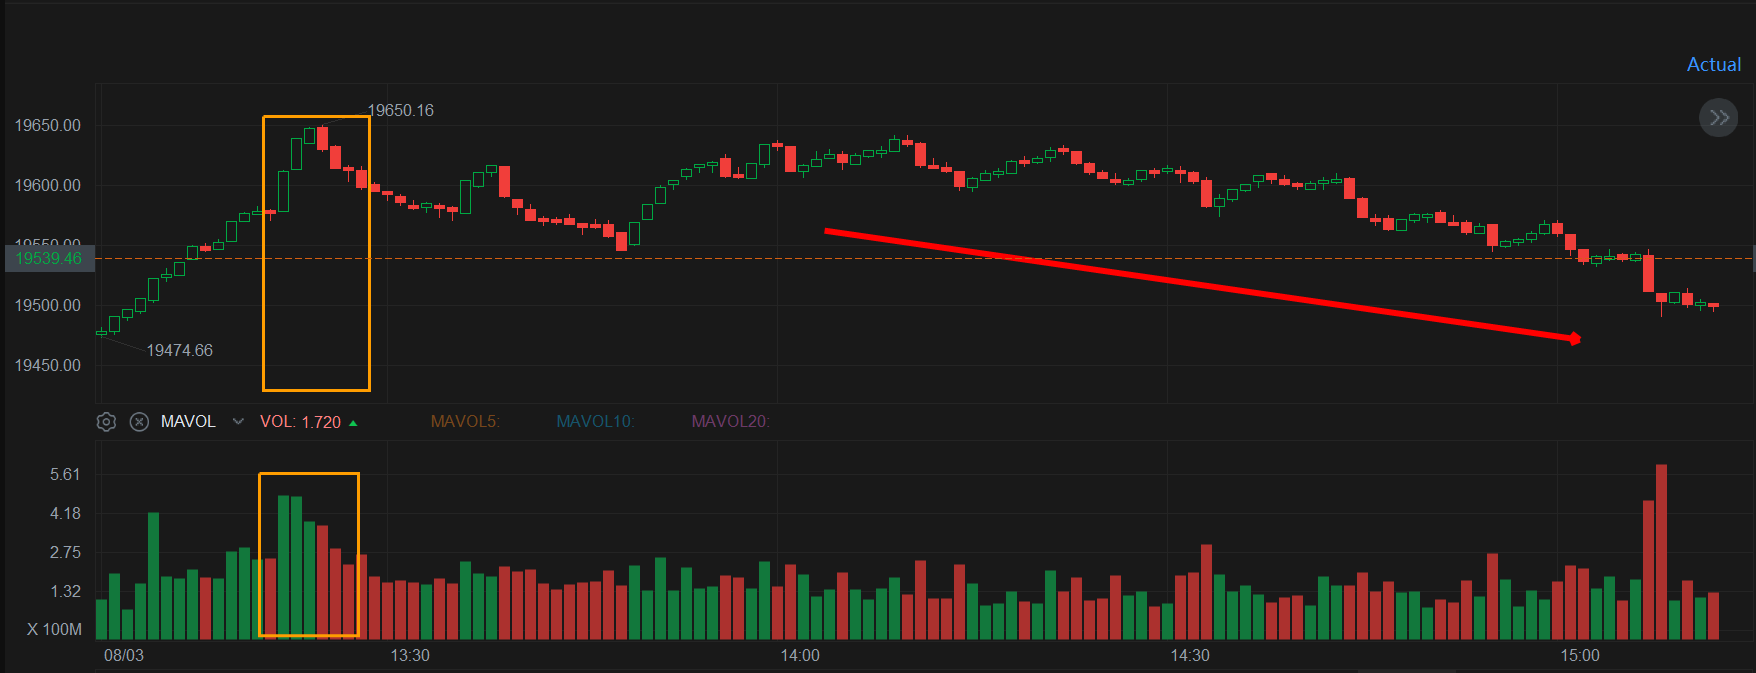
Long bar candle up followed by small candle down: When the price is trading on the way up, you will notice it is difficult for the price to mark up to a new high with multiple down candles formed after a high volume up candle. This happens because usually big players are attracting buyers to buy with the fear-of-missing-out created.
Key factor in resistance is formed: When big players sell their shares or securities, they will require buyers. Therefore, prices near the peak/ resistance often have price action that creates Fear-Of-Missing-Out, such as high volume price spikes.
Utilizing Big Boy Support and Resistance for Trading:
Once support and resistance levels based on big players demand and supply are identified, traders can incorporate this information into their trading strategies:
Buy Near Support: Consider entering long positions near support levels, anticipating a price reversal when institutional buying pressure is likely to emerge.
Sell Near Resistance: Look to exit long positions or initiate short positions near resistance levels, expecting a halt or reversal due to potential institutional selling.
Risk Management and Confirmation:
While support and resistance levels derived from institutional demand and supply can be powerful indicators, risk management is paramount. Traders should:
Use Stop-Loss Orders: Always set stop-loss orders to limit potential losses in case the market doesn't behave as expected.
Follow your analysis, not your expectation: We often trade with the expectation of making profits. Although this is our investment objective, we can’t let our expectations take over our analysis. Try to recall your previous trades, is it always the more you expect to make profits, but end up more losses at the end? This is because of having expectations on making profits on each trade. This will blind ourselves with the expectation that every trade we make will be a profitable trade. Which will end up not following the market & miss out many opportunities for profitable trades & miss out the best cut loss timing for your trades.
As a trader, we need to be clear of the PROCESS to make profits, such as having a non-biased mind to analyse the trades. When we focus too much on our expectations (make profits), we will end up seeing every price up & down as an opportunity, end up holding on losses & trade error increases.
Chart Examples:
Below are chart examples demonstrating how support and resistance levels based on big players demand and supply can be identified and used in trading for HANG SENG index:
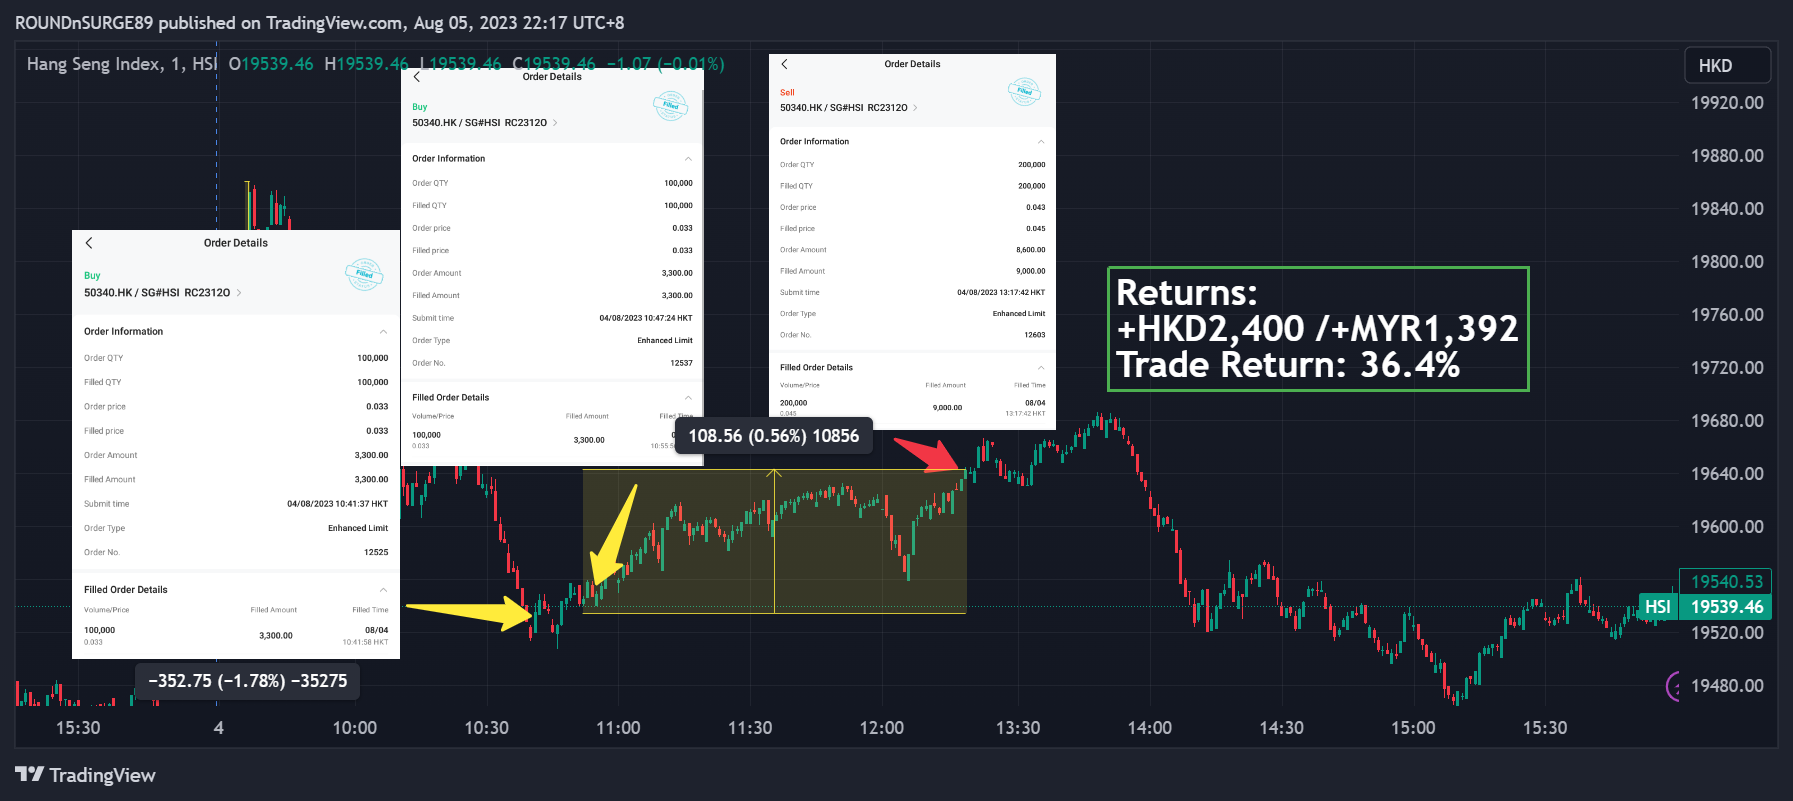
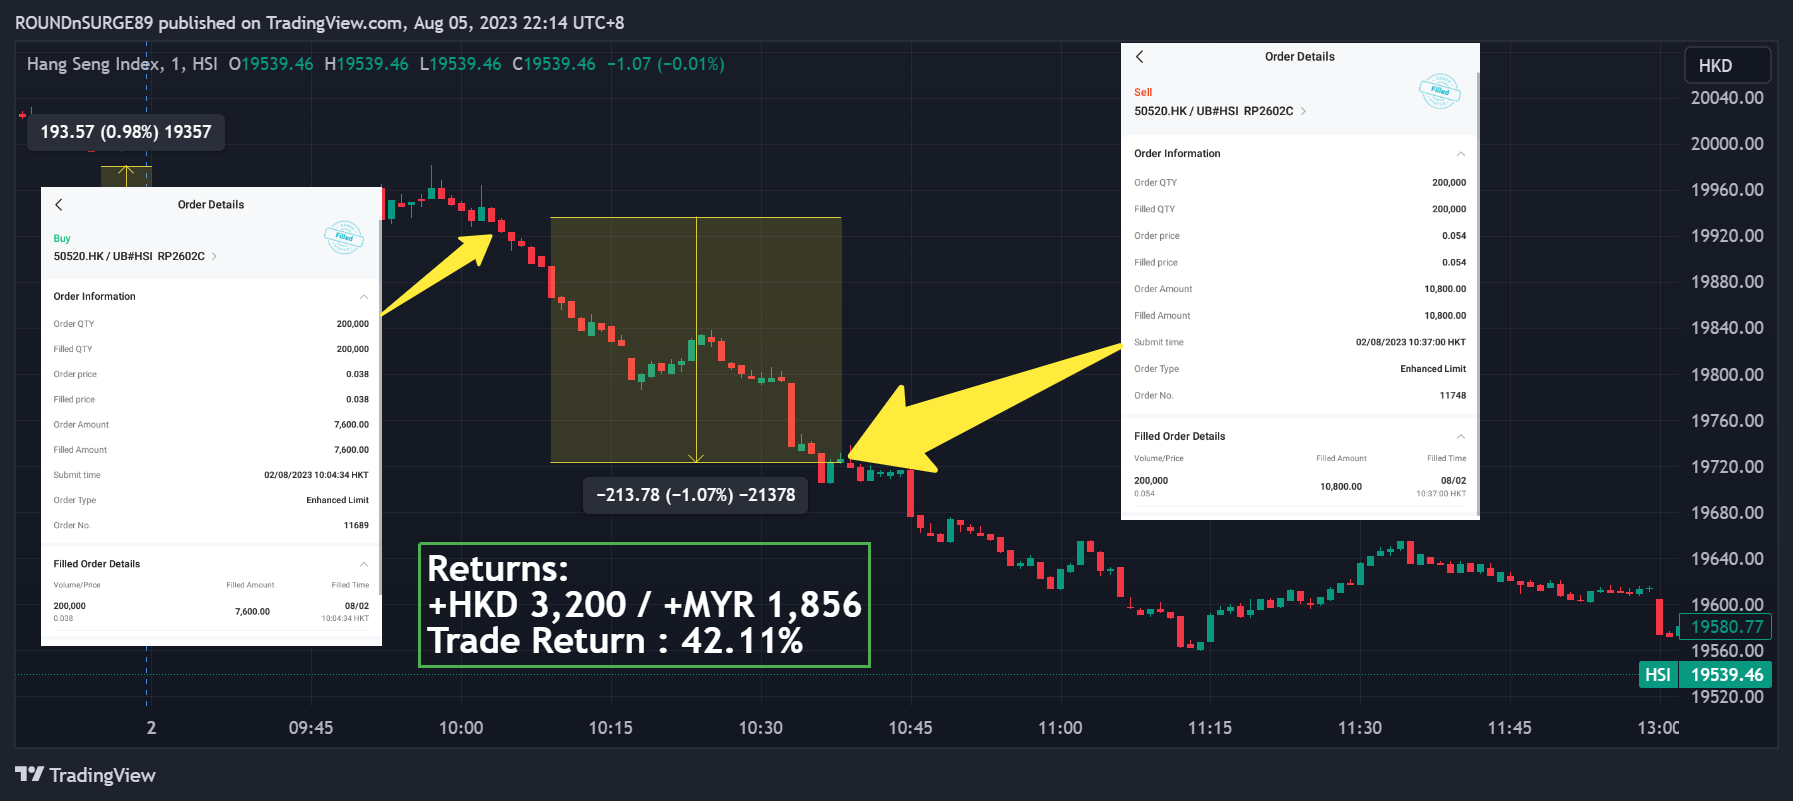
With the analysis skill to find the support & resistance with the understanding of the big players demand & supply. We can time our entry more precisely near the resistance & support for a Bear contract/ Bull contract, then take profit when it is near the resistance or support.
This will help us to reduce entry mistakes & make sound trading decisions on time. You never be late into the right trend after many other indicators confirmation.
Conclusion:
Support and resistance are vital concepts in trading, and understanding them from the perspective of big players’ demand and supply can enhance your trading edge. By identifying the areas where the "big boys" are likely to enter or exit positions, traders can make more informed decisions and improve their overall trading performance. Remember to combine this approach with sound risk management practices and emotions control to increase the likelihood of successful trades.
For more trade examples, watch our YouTube livestream & recordings to learn day trading in Hang Seng index with Kelvin.
YouTube :
HSI Weekly Day Trading Log : A common mistake every trader will encounter #110723
How to trade Hang Seng Index with small capital :
https://youtu.be/jerYg15CgHs
More learning articles in our blog, YouTube videos, & our upcoming webinars.
Blogs : https://www.roundnsurge.com/news
Youtube: https://www.youtube.com/@RoundnSurge89/
Facebook : https://www.facebook.com/RoundnSurge89
Instagram : https://www.instagram.com/roundnsurge/
Webinars : https://www.roundnsurge.com/events
Disclaimer: Trading involves risk, and past performance is not indicative of future results. This blog post is for informational purposes only and should not be construed as financial advice. Always do your own research and consult with a professional financial advisor before making any investment or trading decisions.
More articles on Round & Surge Operator Analysis
Maximize day trading potential returns 10%-50% a day [ Hang Seng Index : CBBC VS. STRUCTURED WARRANTS ]
Created by roundnsurge | Jun 27, 2023
Discover the differences between Callable Bull/Bear Contracts (CBBCs) and structured warrants on the Hang Seng Index (HSI) to maximize your day trading returns.
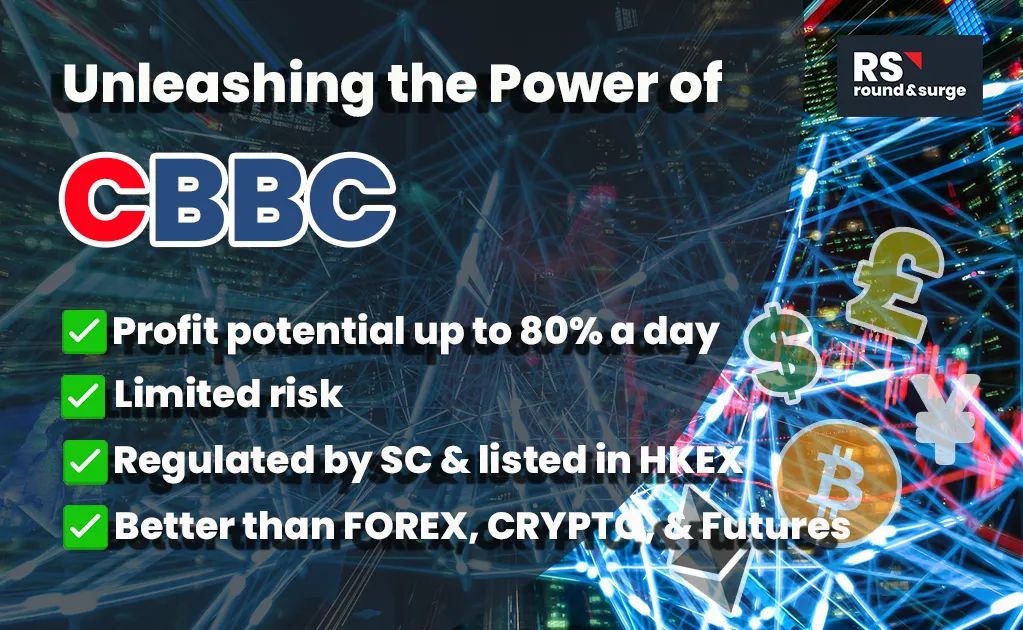
Why Traders Are Switching to CBBCs from Stocks, CFD Forex, Cryptocurrency, and Futures Contracts
Created by roundnsurge | May 22, 2023
Discover the incredible profit potential of Callable Bull/Bear Contracts (CBBC). The ability to profit in rising and falling markets, and lower entry barriers make CBBC the superior choice for trader.
The Shortcut to Success: Short-Term Trading Strategies for KLSE and SGX
Created by roundnsurge | Apr 17, 2023
Identify profitable rebound stocks by following big players' support during downtrends & retracement understanding their marking of price levels in this short-term trading strategy for KLSE & SGX.

Boost Your Income With Trading: Building for the Future vs. Living for the Now
Created by roundnsurge | Apr 05, 2023
Unlock your financial potential with investment and trading strategies for building current and future income.
From Losses to Consistent Profits: An Insider's Guide to Overcoming Trading Experience in the Stock Market
Created by roundnsurge | Feb 04, 2023
Being able to accept our losses is the first step in being able to learn from them and turn that into future profit!
KLSE Day Trading | How to read big boys transaction to make profit | R&S Training class [Cut Scene]
Created by roundnsurge | Jan 29, 2023
We're going to give you an insider's look at how the big boys get their info and make trades, so that you can do it too!

Trading Technique To Find Best Entry & Exit for 2023 Top Stocks
Created by roundnsurge | Jan 12, 2023
We can’t avoid big boys in the stock market, so we learn how they operate & take advantage of their price movement for our better entry & exit.
Discussions
Be the first to like this. Showing 0 of 0 comments
Post a Comment
Featured Posts
New Update. Discover investment communities that resonate with your ideas
One App To Trade Malaysia & US Stock With 0* Commission

Apps


Top Articles
1
2
save malaysia!
4
Good Articles to Share
5
Good Articles to Share
6
BFM Podcast
7
BFM Podcast
8
Good Articles to Share
Gen AI is less efficient than crypto: Early #facebook investor #shorts
#
Stock
Score
Daily Stocks
Stock Name
Last
Change
Volume
Stock Name
Last
Change
Volume
Stock Name
Last
Change
Volume
MQ Trading Signals
Stock
Time
Signal
Duration
No trading signals available.
Stock
Time
Signal
Duration
No trading signals available.
Featured Advertisers / Partners


Ride The Bull Short The Bear
CS Tan
4.9 / 5.0
This book is the result of the author's many years of experience and observation throughout his 26 years in the stockbroking industry. It was written for general public to learn to invest based on facts and not on fantasies or hearsay....