


Stock Pick Year 2014 - kcchongnz
Stock Pick Year 2014 - kcchongnz - CENBOND

Tan KW
Publish date: Wed, 01 Jan 2014, 01:52 PM
Tan KW
0 513,688
Stock Pick Year 2014 from kcchongnz (http://klse.i3investor.com/servlets/cube/kcchongnz.jsp)
Portfolio: http://klse.i3investor.com/servlets/pfs/25718.jsp
TOC: http://klse.i3investor.com/blogs/stock_pick_2014/42879.jsp
Portfolio: http://klse.i3investor.com/servlets/pfs/25718.jsp
TOC: http://klse.i3investor.com/blogs/stock_pick_2014/42879.jsp
Packaging companies in Malaysia
Investment success doesn’t come from “buying good things”, but rather from “buying things well”.
People need packaging for the organization and containment, protection, handling, delivery, advertising and presentation of goods. Examples of packaging include everything from cardboard boxes to food wrappers commonly made of plastic and paper. Packaging is used every day and everywhere in the world all the time. Hence it is viable to include a packaging stock in a diversified investment portfolio.
In Malaysia, there are a number of packaging companies listed in Bursa. Which packaging company should one invest in? Normally when an expert is asked, he would encourage you to invest in the market leader. A market leader is generally one with the highest market share in the industry and with the biggest market capitalization. Let us see Table 1which company below is the market leader.
Table 1: Some packaging companies in Malaysia
|
Company |
Cenbond |
Tomypak |
Daibochi |
BoxPak |
PPHB |
Muda |
Orna |
|
Sales (000) |
186,841 |
216,724 |
278,752 |
264,334 |
139,568 |
1,088,370 |
229,336 |
|
Share price |
1.56 |
1.40 |
4.03 |
2.36 |
0.650 |
0.920 |
0.795 |
|
No. of shares |
120,000 |
109,264 |
113,853 |
60,023 |
109,898 |
303,686 |
75,251 |
|
Market Cap |
187,200 |
152,970 |
458,828 |
141,654 |
71,434 |
279,391 |
59,825 |
Sales and market capitalizations
From the table above, Daibochi, a flexible plastic packaging company is clearly a market leader with 279 million Ringgit in annual sales and a market capitalization of 459m Ringgit. Its competitor in flexible plastic packaging, Tomypak, with 30% less in sales, has its market cap only a third of Daibochi. Muda Holding though has a much higher sales of 1.09 billion, it’s major business is paper manufacturing and its market cap is only 279m. Box-Pack is the leader in corrugated cartons with 264m in annual sales and a market cap of 142m. Public Packaging Holding Berhad, Box-Pak’s competitor in corrugated cartoon, has only half the sales and market cap. Century Bond dominates in paper packaging with a sales of 187m and a market cap of 187m. It has about only 10% in plastic packaging business. All pure packaging companies are considered as small (mostly) to mid cap companies. So should you invest in Daibochi, the market leader in the packaging industry?
I usually look at the performance of the company first before deciding. Let me start me the return of equity of the companies and see which one is the most efficient in utilising the equity of the company. I am particular interested in dissecting the ROE to have a clearer picture how the ROE comes about.
Du Pont analysis
DuPont equation provides a broader picture of the return on equity of a company. It tells where a company's strength lies and where there is room for improvement. It is the epic of financial statement analysis of a company. Investopedia has a very good explanation on why is it important to carry our DuPont analysis on a company’s business as shown in the link below:
http://www.investopedia.com/articles/fundamental-analysis/08/dupont-analysis.asp
Table 2 below shows the plastic packaging firm Tomypak has the highest ROE of 17%.
Table 2: Dissection of ROE
|
Company |
Cenbond |
Tomypak |
Daibochi |
BoxPak |
PPHB |
Muda |
Orna |
|
Net profit margin, |
10.3% |
8.0% |
8.8% |
7.2% |
10.2% |
1.5% |
3.2% |
|
Asset turnover, AT |
0.95 |
1.32 |
1.19 |
1.26 |
0.68 |
0.87 |
1.10 |
|
Financial leverage, |
1.30 |
1.58 |
1.56 |
1.61 |
1.55 |
2.13 |
1.82 |
|
ROE |
13% |
17% |
16% |
14% |
11% |
3% |
6% |
Tomypak achieves the marginal higher ROE than its competitor Daibochi due to its higher asset turnover of 1.32, though its net profit margin is lower at 8.0%. Similarly, Box-Pak achieves substantial higher ROE (14%) than its competitor PPHB (11%) with twice higher sales related to its assets compared to PPHB. Cenbond has a slightly lower ROE of 13% and this number is still acceptable as it is higher than the cost of capital. However Cenbond is the least risky because it has the lowest leverage of them all at 1.3. Its net profit margin at 10.3% is the highest among the packaging companies. Muda is the worst among the lot with meagre net profit margin (1.5%) and very low ROE of 3%, way below the cost of capital.
However, it is not really fair to compare ROE among the companies. Firstly net profit can be skewed by one-off and non-operating items dramatically. Secondly companies have different capital structures and they are not reflected in ROE. ROE can also be artificially enhanced with the use of excessive debt, which can be dangerous if there is a severe economic downturn and liquidity problem in the market. Some companies like Cenbond has a lot of excess cash (64 sen per share) not needed for the operations, while Muda Holding has huge debt. Hence a better efficiency metric would be the return of invested capital which earnings and all capitals are accounted for. Appended is a link in i3 describing what ROIC is and its usefulness in comparison with ROE:
http://klse.i3investor.com/blogs/kianweiaritcles/36668.jsp
Table 3 below clearly shows that Cenbond has the best operating efficiency by a wide margin with a ROIC of 22%.
Table 3: Comparisons of ROE and ROIC
|
Company |
Cenbond |
Tomypak |
Daibochi |
BoxPak |
PPHB |
Muda |
Orna |
|
ROE |
13% |
17% |
16% |
14% |
11% |
3% |
6% |
|
ROIC |
22% |
15% |
16% |
13% |
12% |
4% |
6% |
Taking the efficiency into consideration, the first 5 companies with ROE and ROIC of more than 10% are considered investible with the order of the following ranking; Cenbond, Daibochi, Tomypak, Box-Pak, and PPHB.
Value value and value
I have mentioned many times before, a good company is not necessary a better investment as in investment, the return of investment is what we are looking for, and the price you pay determines your return. So which company is the best value buy?
Table 4 below shows the corrugated carton maker, PPHB at 65 sen now is the cheapest buy with a PE ratio of 5.0 and an Enterprise value just 3.4 times its earnings before interest and tax.
Table 4: Market Valuations
|
Company |
Cenbond |
Tomypak |
Daibochi |
BoxPak |
PPHB |
Muda |
Orna |
|
Price |
1.54 |
1.41 |
4.12 |
2.25 |
0.65 |
0.92 |
0.79 |
|
PE |
9.6 |
8.9 |
19.0 |
7.1 |
5.0 |
17.4 |
8.2 |
|
EV/Ebit |
4.6 |
6.7 |
13.6 |
6.3 |
3.4 |
13.2 |
8.8 |
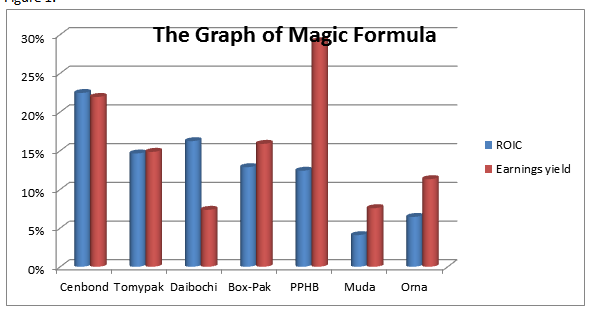
Cenbond at 1.54 is the next value for money buy with a PE ratio of 9.6 and a EV/Ebit of 4.6. As Cenbond has a much better operating efficiency of 22%, and a high earnings yield (ebit/EV) also of 22%, it has a higher ranking using the Magic Formula of Joel Greenblatt as shown in figure 1 below.
I have added Cenbond as a packaging stock in my investment portfolio for 2014. Why not? I am buying the best thing in this industry and buying it well.
Figure 1:
KC Chong (31/12/13)
kcchongnz has left a new comment on your post "Stock Pick Year 2014 - kcchongnz - CENBOND":
Posted by yfchong > Dec 31, 2013 09:41 PM | Report Abuse
Dear bro KC, I would like to Know wat is the intrinsic value of cenbond thks.
Posted by jennylee1382 > Dec 31, 2013 11:16 PM | Report Abuse
Kcchongnz can buy at what px
I am using the same valuation method as the gentleman below with some slight different assumptions. However, our valuation do not differ by more than 10%. that is pretty close.
Posted by houseofordos > Dec 23, 2013 12:12 AM | Report Abuse
4. Valuation
a. DCF valuation
As CENBOND's earnings are consistent and it generates free cashflow, a discounted cash flow valuation was used. Since CENBOND's latest cashflow was exceptionally high, I decided to use the 6 years average FCF as a starting point in the analysis to avoid over-optimistic valuation results. With the assumption of a 5% growth for the next 10 years and 3% perpetuity growth, the FCF/share came up to RM2.14 which represents a 25% margin of safety.
Current stock price $1.58
Share outstanding (Mil) 120000
This year FCF $13,871
Next year's FCF (mil) $14,564
Growth for the next 5 and 10 years 5.0%
Teminal growth rate, g 3.00%
Discount rate, R 10.0%
PV of FCFF of core operations $203,000
Non-operating cash $76,865
Investment properties $0
Interest in associates $0
Debts ($4,599)
PV of FCFE $275,266
Less minority interest ($18,813) 6.8%
FCFE $256,453
Number of shares 120000
FCF per share $2.14 34% higher than = $1.58
MOS 25%
Using a reverse DCF calculation shows that at the current price, the market is expecting almost no growth in CENBOND's free cashflow at all for the rest of its life which is highly unlikely.
Posted by kcchongnz at Jan 1, 2014 12:50 PM
kcchongnz has left a new comment on your post "Stock Pick Year 2014 - kcchongnz - CENBOND":
What is the intrinsic value of Cenbond?
Posted by yfchong > Dec 31, 2013 09:41 PM | Report Abuse
Dear bro KC, I would like to Know wat is the intrinsic value of cenbond thks.
Say if a big packaging company, like Oji Paper wants to buy over Cenbond, how would they negotiate on how much to pay?
What they can do is to refer to a past transaction of similar nature, for example how much HPI was sold at what metric. Or another way is they refer to the average EV/Ebit of the seven companies on the list, and then pay the price of the average EV/Ebit. Or they may refer to four of them, or whatever, all depending on negotiations.
The average EV/Ebit of these companies is 8.09, and Cenbond’s Ebit for the last financial year is RM24,951,000. So the fair price would be an enterprise value of 8.09*24,951,000=RM210 million. This is translated to a market capitalization of RM280m, or RM2.34 per share. Whatever excess cash the buyer pocket, and whatever debts they pay.
They can also use EV/Ebitda, or even EV/Sales, especially when there is no profit yet, or whatever. Of course they can also use Price-to-book value and other metrics also.
But I think Ev/Ebit, or EV/Ebitda is very commonly used in private market transactions.
Company Cenbond Tomypak Daibochi BoxPak PPHB Muda Orna Average
Price 1.54 1.41 4.12 2.25 0.650 0.920 0.790 xxxx
EV/Ebit 4.56 6.73 13.59 6.30 3.43 13.21 8.83 8.09
EV/Ebitda 3.80 5.58 10.32 5.57 2.71 6.77 5.13 5.70
Posted by kcchongnz at Jan 1, 2014 03:31 PM
kcchongnz has left a new comment on your post "Stock Pick Year 2014 - kcchongnz - CENBOND":
Earnings Power Valuation for Cenbond
Valuation is really a very tough task to carry out. It has to be a forward looking exercise. That means we have to make some forecast of a company’s future cash flows. However forecasting is a very hazardous endeavour and it has been proven again and again that forecasting of future cash flows, especially the optimistic ones often run out by huge errors.
Earnings Power Value (EPV) was postulated by a Columbia University Professor and proven successful investor Bruce Greenwald. It is an estimate of the value of a company from its ongoing operations only.
First we would assume that current revenue is sustainable. We then normalize the earnings to the business cycle. This eliminates the effects on profitability of valuing the firm at different points in the business cycle. This means that we are considering the average % operating profit over 5-8 years. This average would then be applied to current sales. The beauty of EPV, for value investors, is that the numbers used to calculate it are no growth free cash flows. By using no growth free cash flows we eliminate the predictions of future growth and as such arrive at a number which we can be fairly certain of. This isn't to say that some companies can't expect significant growth, but as value investors we refuse to pay for it. The next step is to subtract interest bearing debts and any minority interest and add the cash not required to run the business; and any other investment which has not been consolidated into its results,. The final step in calculating Earnings Power Value is to divide the final cash flow number by the cost of capital. This gives us the present value of a perpetuity without any estimation of growth. That is the Earnings Power Value. Anybody interested in this method can read from the appended link below:
http://www.stockopedia.com/
Lets carry out a valuation exercise of Cenbond here using its latest revenue for its ordinary business for year ended March 2013. The average Ebit margin used for the last eight years is 11% as compared to 14% last year. The EPV is shown below:
Revenue for 2013 186841
Ebit (margin at 11%) 25941
less income tax (23%) -6093
EBIT after tax 19848
Add average D&A 2611
Less average capex -5221
Normalized Ebit 17237
Cost of capital, R 10.0%
Capitalized earnings=Nor Ebit/R 172373
Add cash 76865
Other investments 0
Less debts -4599
EPV 244639
Less minority interest (7%) -16719
EPV to common shareholders 227920
Number of shares 120000
EPV/share 1.90
Using the conservative EPV method which can be considered as a bad-case scenario, the intrinsic value of Cenbond is RM1.90. As this is still above its present share price of RM1.72, it appears that Cenbond is a good investment for long term.
Posted by kcchongnz at Jan 11, 2014 06:45 PM
kcchongnz has left a new comment on your post "Stock Pick Year 2014 - kcchongnz - CENBOND":
Katsenelson’s absolute PE for CENBOND (12/1/14)
Instead of using the relative PE valuation method for different industry, Vitaliy created an absolute and more robust method that can be used for any company. The absolute P/E model makes adjustment according to the following:
• An average company that does not grow earnings and pays no dividend, use PE=8
• For every unit of earnings growth from 0-16%, P/E increases 0.65 points, above 16% growth, use 0.5 points. Earnings growth is based on 5 years projection.
• Every percent increase in dividend yield, P/E increase by 1 point
• Adjust P/E according to business , financial risks and earnings visibility
For those who are interested in this method can refer to the following link:
http://klse.i3investor.com/
Last year, net income of Cenbond grew by 32% from 15.5m to 20.6m. For the last 7 years the compounded annual growth rate has been 12.4%. For adjusting the absolute PE, we take half the rate as a conservative assumption, or a growth of earnings of 6.2%.
Basic PE for CENBOND with a growth of 6.2% and a dividend yield for last year of 2.6% is adjusted by the formula;
Basic PE = 8 + 0.65*6.2 + 2.6 = 12.8
Business risk: CENBOND’s business has high efficiencies with return of assets of 9.7% (>7%) and return of equity of 12.7%. Last year cash return (FCF/IC) is at 37% and average of last 7 years is 16%. Hence an arbitrary 10% discount is applied to its business risk.
Financial risk: CENBOND has a very healthy balance sheet with an excess cash of 64 sen per share. It has very little debt. Current ratio is very high at 4.3. Free cash flow is abundant at 7 times total debt. Hence a discount of 10% is applied to the financial risk.
Earnings visibility: CENBOND has stable and reasonable gross and net profit margin of 20% and 10% respectively. Its cash flow from operations averages about 140% of its net income. It has average free cash flow of about 8% of revenue. No premium or discount is applied to earnings visibility.
Hence the absolute PE for CENBOND is:
Abs PE = 12.8* [1+(1-90%)] *[1+(1-90%)] * [1+(1-100%)] = 15.5
Fair value of CENBOND= 15.5*0.16 = RM2.48
There is hence a 44% upside to its present share price of 1.72 on 12 January 2014.
Posted by kcchongnz at Jan 12, 2014 04:34 PM
Related Stocks
| Chart | Stock Name | Last | Change | Volume |
|---|
More articles on Stock Pick Year 2014 - kcchongnz
Discussions
7 people like this. Showing 41 of 41 comments
Thank you KC for all your unselfish sharing of knowledge.
Wishing you a joyful and fruitful 2014 :P
2013-12-31 15:13
Dear bro KC, I would like to Know wat is the intrinsic value of cenbond thks.
2013-12-31 21:41
hi KC, a clear and concise analysis. A few questions on PPHB as the extremely high earnings yield attracted my attention :-
Based on the PE numbers you are getting, it looks like this based on 2012 annual report ? I was getting higher number as you since I am using trailing 12 months. Can you share how you got EV/EBIT of 3.4 ? Besides excess cash, did you subtract anything else from the EV calculation from 2012 results ?
EV = Market Cap + Debt + Minority interest - Excess cash
I played around with the numbers and I think you probably subtracted investment properties, investment in subs and land held for development assuming that these are not contributing greatly to the revenue ?
2014-01-01 00:31
Dear Kcchongnz,
What is the standard for EV/Ebit ?
Please advise.
Thank you.
2014-01-01 01:53
Posted by yfchong > Dec 31, 2013 09:41 PM | Report Abuse
Dear bro KC, I would like to Know wat is the intrinsic value of cenbond thks.
Posted by jennylee1382 > Dec 31, 2013 11:16 PM | Report Abuse
Kcchongnz can buy at what px
I am using the same valuation method as the gentleman below with some slight different assumptions. However, our valuation do not differ by more than 10%. that is pretty close.
Posted by houseofordos > Dec 23, 2013 12:12 AM | Report Abuse
4. Valuation
a. DCF valuation
As CENBOND's earnings are consistent and it generates free cashflow, a discounted cash flow valuation was used. Since CENBOND's latest cashflow was exceptionally high, I decided to use the 6 years average FCF as a starting point in the analysis to avoid over-optimistic valuation results. With the assumption of a 5% growth for the next 10 years and 3% perpetuity growth, the FCF/share came up to RM2.14 which represents a 25% margin of safety.
Current stock price $1.58
Share outstanding (Mil) 120000
This year FCF $13,871
Next year's FCF (mil) $14,564
Growth for the next 5 and 10 years 5.0%
Teminal growth rate, g 3.00%
Discount rate, R 10.0%
PV of FCFF of core operations $203,000
Non-operating cash $76,865
Investment properties $0
Interest in associates $0
Debts ($4,599)
PV of FCFE $275,266
Less minority interest ($18,813) 6.8%
FCFE $256,453
Number of shares 120000
FCF per share $2.14 34% higher than = $1.58
MOS 25%
Using a reverse DCF calculation shows that at the current price, the market is expecting almost no growth in CENBOND's free cashflow at all for the rest of its life which is highly unlikely.
2014-01-01 12:50
Posted by Ooi Teik Bee > Jan 1, 2014 01:53 AM | Report Abuse
Dear Kcchongnz,
What is the standard for EV/Ebit ?
Please advise.
Thank you.
This depends on the individual expectation as well as the particular industry. But when we compare valuations of companies of the same industry what what we do now for the packaging industry, then obviously we would prefer a lower EV/Ebit one. But in absolute term, I think the following discussions before are interesting:
Posted by kcchongnz > Dec 11, 2013 02:02 PM | Report Abuse X
Posted by houseofordos > Dec 11, 2013 01:03 PM | Report Abuse
I was just wondering what would the basic EV/EBIT be for the calculations if we were to use EV/EBIT rather than PE for valuation method in this thread.
This sounds like an interesting statement to me. First of all, all these thing is arbitrary. For example why use the base PE of 8? Why not 10, 5, 15? But if you flip the PE ratio over, the earnings yield (E/P) is about 12%. That may be is the yield the original author of this absolute PE valuation method wants. What about EV/Ebit, what should be the base then?
All I can say is if you replace P/E with EV/Ebit, you should demand a EV/Ebit of lower than 8 above. This is because:
1) The cost of debt is lower than the cost of equity, and hence valuation using EV must be lower when compared with market capitalization.
2) The denominator Ebit has not taken tax into consideration. Hence EV/Ebit must be lower than PE.
But how much lower we must demand EV/Ebit than PE ratio? Again it is arbitrary. What about an earnings yield of 20%, or EV/Ebit of 5? Or should earnings yield be 15%, or EV/Ebit of 6.7?
It also depends on what kind of industry it is.
Posted by houseofordos > Dec 11, 2013 02:20 PM | Report Abuse
Tax rate of about 25%, cost of equity (the returns required to own the stock) of about 10%
So lets say the base EV/EBIT = Basic P/E (8) x 0.75 x 0.9 = 5.4x which is close to what you calculated
Your last statement "It also depends on what kind of industry it is." is more like relative P/E approach. In this case I would just compare the EV/EBIT for companies in the same business and put a target EV/EBIT based on the average EV/EBIT of all the companies whereas the absolute EV/EBIT method would assess the business and financial risks to come up with the target EV/EBIT. I suppose the more practical way should be the former as any take over would be justified based on relative valuations rather than absolute.
Posted by houseofordos > Dec 11, 2013 02:25 PM | Report Abuse
Mistake... actually
Basic EV/EBIT = Basic P/E (8) x (1-0.25) x (1-0.04) = 5.7x (around 6x)
Where 25% is the tax rate
and 4% is the difference between cost of equity and cost of debt (could be subjective.. assuming 6% cost of debt)
2014-01-01 13:25
Dear Kcchongnz,
In my mind before I ask you, I also think that 8 is a nice figure. I just want to confirm with FA Sifu. Thank you for all your help to make me a good trader and investor. Happy New Year 2014.
Thank you
2014-01-01 13:37
What is the intrinsic value of Cenbond?
Posted by yfchong > Dec 31, 2013 09:41 PM | Report Abuse
Dear bro KC, I would like to Know wat is the intrinsic value of cenbond thks.
Say if a big packaging company, like Oji Paper wants to buy over Cenbond, how would they negotiate on how much to pay?
What they can do is to refer to a past transaction of similar nature, for example how much HPI was sold at what metric. Or another way is they refer to the average EV/Ebit of the seven companies on the list, and then pay the price of the average EV/Ebit. Or they may refer to four of them, or whatever, all depending on negotiations.
The average EV/Ebit of these companies is 8.09, and Cenbond’s Ebit for the last financial year is RM24,951,000. So the fair price would be an enterprise value of 8.09*24,951,000=RM210 million. This is translated to a market capitalization of RM280m, or RM2.34 per share. Whatever excess cash the buyer pocket, and whatever debts they pay.
They can also use EV/Ebitda, or even EV/Sales, especially when there is no profit yet, or whatever. Of course they can also use Price-to-book value and other metrics also.
But I think Ev/Ebit, or EV/Ebitda is very commonly used in private market transactions.
Company Cenbond Tomypak Daibochi BoxPak PPHB Muda Orna Average
Price 1.54 1.41 4.12 2.25 0.650 0.920 0.790 xxxx
EV/Ebit 4.56 6.73 13.59 6.30 3.43 13.21 8.83 8.09
EV/Ebitda 3.80 5.58 10.32 5.57 2.71 6.77 5.13 5.70
2014-01-01 15:31
There was a mistake in my earlier computation of CENBOND intrinsic value using DCF method which bsnpg corrected.
Do you have any hidden gem for 2013?
Dec 23, 2013 05:43 PM | Report Abuse
bsnpng, actually your calculation is correct. I forgot to key in the FCF growth from year 5 to 10 and was assuming 0 growth in my original calculation. Thanks for checking my numbers. My new FCF/Share after correction is RM2.40.
2014-01-01 17:05
Put aside valuation, According to market hearsay, Oji Paper very close to take over Cenbond but it somehow did not materialise due to the price disagreement. The take over price is around Rm 2.20. That's why you see the share price has dropped by 25% since then from 1.95 to 1.55 now. Are they back to the negotiation table? I think Oji Paper still has very great interest on Cenbond. Let's wait and see how the final deals will turn out.
2014-01-01 17:39
Thks bro KC happy new year I like your posting especially the hidden gem 2013. All the best for 2014....
2014-01-01 19:33
Kcchong... you never mention net cash per share of cenbond is almost 1/3 of market cap if i am not mistaken. Hence actual pe is very very low.....
2014-01-02 01:23
gark, yeah, Cenbond has a lot of net cash in its balance sheet. Two companies of similar business can have the same EPS, but one with plenty of excess cash, and one without, or even with high debt. Should they be accorded with the same PE ratio? Of course not. First of all the latter one is so much more riskier as an investment. Secondly, the excess cash of the earlier one can be distributed to its shareholders and they will still earn the same EPS. That is why judging the cheapness of companies with PE ratio is not a good assessment.
Hence you notice I emphasize more on enterprise value which both earnings and capitals of the equity and debt providers are considered, rather than just the equity holder in PE ratio assessment. Using the EV/Ebit, or EV/Ebitda will take care of the excess cash discrepancy as this is excluded, and debts included in EV computation.
2014-01-02 08:23
Good analysis.. you covered everything..
Also cenbond dividend is on uptrend for the past 3 years and should continue on uptrend looking at how much cash they have.
2014-01-02 10:40
Another undervalue share you might be interested in in Insas, 50% market cap in cash, another 50% market cap in shares of Inari Bhd.
You more or less buy the rest of the company for free...
2014-01-02 10:41
Hi Kcchongnz, just to clarify how did you get the ROIC of 22% for cenbond? Are you using the formula as in NOPAT/(Total assets - Cash) - (Non-interest bearing liabilities) or other formula calculation?
2014-01-09 17:01
Posted by JT Yeo > Jan 9, 2014 05:01 PM | Report Abuse
Hi Kcchongnz, just to clarify how did you get the ROIC of 22% for cenbond? Are you using the formula as in NOPAT/(Total assets - Cash) - (Non-interest bearing liabilities) or other formula calculation?
When you use any "formula" to calculate anything, you must understand the rationale of the formula.
ROIC is the return on invested capital, or NOPAT/IC. what is the invested capital in the business, the "ordinary" business? Your formula of (Total assets - Cash) - (Non-interest bearing liabilities) would normally be correct and it is often given by text books too. It is the asset used, less any excess cash and non-interest bearing liabilities. This excess cash by definition is "excess" and is not needed in the ordinary business. Non-interest bearing liabilities is "other people's money", not "invested" by you in the form of equity or debts. Hence it is excluded from "invested capital".
But text book formula is usually simplified. In really life financial statements in Malaysia, the "total assets" consist of many other stuff not concerning the "ordinary" business; for example some property investments for some non-property companies; investments in associates and joint venture companies; some "other investments" etc. These stuff are generally not consolidated into the financial statements of the company, and hence by using your formula, you nay have over-estimated the invested capital, and hence resulting in a lower actual ROIC.
Thus for most people, I would advise them to use invested capital as:
IC = PPE + net working capital
Where net working capital=receivables+ inventories - payable
The two methods generally result in the same invested capital if in your earlier method of estimation you have made the proper adjustments.
Try figuring them out.
2014-01-09 17:30
Hi Kcchong, I have a few questions.
1:If using NOPAT/IC where IC = PPE + net working capital
Where net working capital=receivables+ inventories - payable
The "total assets" consist of many other stuff not concerning the "ordinary" business; for example some property investments for some non-property companies; investments in associates and joint venture companies; some "other investments" etc. These stuff are generally not consolidated into the financial statements of the company, and hence by using your formula, you nay have over-estimated the invested capital, and hence resulting in a lower actual ROIC.
Then, do you include Share of profit of associates and Investments in associates when calculating NOPAT/IC for Kfima(sorry for a spam here)?Do you include Non-ordinary(non core) business when calculating NOPAT/IC?
2: what is your view for the below statement. How do you treat deferred tax assets and tax liabilities when calculating IC
Actually, including taxes payable is a judgment call. Many analysts let this item remain as a source of invested capital (as we did here) because most companies never pay these deferred taxes. These taxes are perpetually deferred, and for this reason, some call them "quasi equity". If the company were going to pay these taxes, we would exclude taxes payable from invested capital, but since the company - in practice - is going to hold onto the extra cash, we are going to charge them for the use of it.
If I am not mistaken, Joel encourages the investor to use EBIT when calculating ROIC because different companies have different debt and tax rates, using ebit can avoid the distortions arising from differences in tax rates and debt levels.
3: what is your valuation method for Tas offshore? its CFFO and FCF has been negative for a few years. but its price is still increasing.
2014-01-10 00:44
Posted by digiuser016 > Jan 10, 2014 12:44 AM | Report Abuse
Hi Kcchong, I have a few questions.
1:If using NOPAT/IC where IC = PPE + net working capital
Where net working capital=receivables+ inventories - payable
The "total assets" consist of many other stuff not concerning the "ordinary" business; for example some property investments for some non-property companies; investments in associates and joint venture companies; some "other investments" etc. These stuff are generally not consolidated into the financial statements of the company, and hence by using your formula, you nay have over-estimated the invested capital, and hence resulting in a lower actual ROIC.
Then, do you include Share of profit of associates and Investments in associates when calculating NOPAT/IC for Kfima(sorry for a spam here)?Do you include Non-ordinary(non core) business when calculating NOPAT/IC?
Me: This is my views as a non-accountant and a non-finance professional
1) NOPAT/IC
both the numbers used for the numerator and denominator have to be consistent with each other; NOPAT, or net operating profit after tax takes on the "operating profit" which does not include other profit sources such as from associates, JV, one-time off items etc. Likewise IC excludes investments in associates, jv and other non-ordinary business.
2: what is your view for the below statement. How do you treat deferred tax assets and tax liabilities when calculating IC
Actually, including taxes payable is a judgment call. Many analysts let this item remain as a source of invested capital (as we did here) because most companies never pay these deferred taxes. These taxes are perpetually deferred, and for this reason, some call them "quasi equity". If the company were going to pay these taxes, we would exclude taxes payable from invested capital, but since the company - in practice - is going to hold onto the extra cash, we are going to charge them for the use of it.
Me: Yes, a judgement call remains as a judgement. If you use the formula below without any adjustment, you would have included the deferred tax credits or liabilities in the calculation of IC.
IC= (Total assets - Cash) - (Non-interest bearing liabilities)
If you use the other formula, IC = PPE + net working capital
Then you would have ignored them. My judgement is to ignore them. But seriously generally how much are there deferred tax credits/liabilities for companies which could affect your calculation of ROIC?
If I am not mistaken, Joel encourages the investor to use EBIT when calculating ROIC because different companies have different debt and tax rates, using ebit can avoid the distortions arising from differences in tax rates and debt levels.
Me: When you talked about ROIC, the R or return straightly has to be an after-tax return which is NOPAT, and not Ebit. For the Magic Formula used by Greenblatt, he ranked those stocks with Ebit/EV, and ROIC. There won't be any significant difference if he ranked them by NOPAT/EV, except a little more work in computing NOPAT.
3: what is your valuation method for Tas offshore? its CFFO and FCF has been negative for a few years. but its price is still increasing.
Me: Does the share price increase has anything to do with valuation?
You can't value TAS with free cash flow as there is none. But that doesn't mean TAS is a hopeless company. It just means that for the present moment because of its expansionary business, a lot of cash is tied up in inventories and receivables. It also doesn't mean that the customers don't pay them, or the tugboats, AHTS cannot be sold. It could also mean that too. I don't know unless one knows about its business well.
It doesn't mean without FCF you can't value TAS. There are many other valuation methods, such as using its present or average Ebit instead of FCF.
2014-01-10 07:04
Kcchongnz, thanks for the answer. Greatly appreciate it.
I just have a general question that I wish to get your opinion. I have been searching for small cap companies which has high ranking on magic formula and ROIC. However when I look into these companies ,although they have high ROIC but their profit has been growing extremely slow or stagnant for a few years. Perhaps these companies only invest in maintenance capex but not growth capex I am not sure, and Buffett also seems to love these kind of companies that doesn't really grow but generate plenty of FCF. And indeed all these companies are piling up on cash and have strong FCF. My question is that from your view point, if these companies does not pay out dividend and with little to no growth, do you think consistent high ROIC with ultimately have a positive effect on the share price itself? Thanks a lot.
2014-01-10 21:33
JT Yeo,
First of all, if you find any company fitting the Magic formula, i.e. high ROIC and high earnings yield (Ebit/EV), can you please let me know?
30 years ago my boss was at 40 years old and he was still single then. He couldn’t find a life partner because as the first criterion he wanted a wife who would love him very much. Secondly he wanted the wife to be a very 溫柔賢淑, a good wife. Thirdly he wanted her take care of him very well. Fourthly she must be well educated. Fifthly she must young and pretty. And she must not simply spend his money which he had saved up quite a lot because of his stingy behaviour, etc.
Is it easy to find one? I would be happy if the first two criteria; loving me and a good wife were met. Of course if more criteria are met, that would be wonderful. But is this place Heaven?
“If I had to identify a single key to consistently successful investing, I’d say it’s “cheapness.” Buying at low price relative to intrinsic value (rigorously and conservatively derived) holds the key to earning dependably high returns, limiting risk and minimizing losses.” Howard Marks
The above can be achieved buying Cenbond at RM1.54 when I first wrote this article on packaging companies. The earnings yield (Ebit/EV) was at a high of 23%. Even at RM1.72 now, earnings yield is still very high at 19%, much higher than my requirement of 12%.
Some more this Cenbond is also a “good wife” who is 溫柔賢淑. Its ROIC is very high at 22%, much higher than my 12% requirement. What else do you want?
Ok I know you want your wife also takes care of you very well. You want Cenbond to be a growth stock. Cenbond net profit grew at a compounded annual growth rate of 12% for the last 7 years. And as one of the leading paper packaging companies, its future also looks bright. What else you want?
Cenbond also has good cash flows, very healthy balance sheet etc. So this potential wife meets a lot of other criteria too.
For your question of “do you think consistent high ROIC with ultimately have a positive effect on the share price itself?”, I cannot answer you as I don’t have a crystal ball in front of me and I won’t know the behaviour of the investors. But I do believe in what Warren Buffet says:
In the short term, the market acts like a voting machine; but in the long term, it is a weighing machine.
Don’t forget to tell me when you find any stock which meets just the two criteria of the Magic Formula, ok?
2014-01-11 11:47
Deferred tax assets and liabilities would crystalise in future and need to be considered if the enterprise is valued as a going-concern for the foreseeable future using income approach.
The only reason why deferred tax assets may not be realisable is when the enterprise is unable to generate future profits.
Whereas, Deferred tax liabilities will decline when the enterprise reaches post-expansion and towards stability period in the future. When it makes good profits in the future, it will pay income taxes at an effective rate higher than what it is currently paying. Deferred tax liabilities arise due to common tax incentive (via faster tax depreciation in tax computation)given to encourage capital investment by enterprises to allow them to pay less tax while investing in more fixed assets.
Personally speaking, I browsed through KFIMA and CENBOND briefly and decided not to buy them.
2014-01-11 15:04
Earnings Power Valuation for Cenbond
Valuation is really a very tough task to carry out. It has to be a forward looking exercise. That means we have to make some forecast of a company’s future cash flows. However forecasting is a very hazardous endeavour and it has been proven again and again that forecasting of future cash flows, especially the optimistic ones often run out by huge errors.
Earnings Power Value (EPV) was postulated by a Columbia University Professor and proven successful investor Bruce Greenwald. It is an estimate of the value of a company from its ongoing operations only.
First we would assume that current revenue is sustainable. We then normalize the earnings to the business cycle. This eliminates the effects on profitability of valuing the firm at different points in the business cycle. This means that we are considering the average % operating profit over 5-8 years. This average would then be applied to current sales. The beauty of EPV, for value investors, is that the numbers used to calculate it are no growth free cash flows. By using no growth free cash flows we eliminate the predictions of future growth and as such arrive at a number which we can be fairly certain of. This isn't to say that some companies can't expect significant growth, but as value investors we refuse to pay for it. The next step is to subtract interest bearing debts and any minority interest and add the cash not required to run the business; and any other investment which has not been consolidated into its results,. The final step in calculating Earnings Power Value is to divide the final cash flow number by the cost of capital. This gives us the present value of a perpetuity without any estimation of growth. That is the Earnings Power Value. Anybody interested in this method can read from the appended link below:
http://www.stockopedia.com/content/how-does-the-earnings-power-valuation-technique-epv-work-60553/
Lets carry out a valuation exercise of Cenbond here using its latest revenue for its ordinary business for year ended March 2013. The average Ebit margin used for the last eight years is 11% as compared to 14% last year. The EPV is shown below:
Revenue for 2013 186841
Ebit (margin at 11%) 25941
less income tax (23%) -6093
EBIT after tax 19848
Add average D&A 2611
Less average capex -5221
Normalized Ebit 17237
Cost of capital, R 10.0%
Capitalized earnings=Nor Ebit/R 172373
Add cash 76865
Other investments 0
Less debts -4599
EPV 244639
Less minority interest (7%) -16719
EPV to common shareholders 227920
Number of shares 120000
EPV/share 1.90
Using the conservative EPV method which can be considered as a bad-case scenario, the intrinsic value of Cenbond is RM1.90. As this is still above its present share price of RM1.72, it appears that Cenbond is a good investment for long term.
2014-01-11 18:45
KC, I got about same number as you for EPV method. Just wondering how would you adjust the valuation if a company has issued warrants or convertible stock which could dilute shareholder EPV ?
2014-01-11 20:01
Kcchong, Thank you for your sharing. Greatly appreciate it.
Hi Sensemaker, thank you for your sharing as well.
Mind to explain why you have decided not to invest in Kfima and Cenbond?
2014-01-11 23:37
Hi JyYeo, I have same thought as Kcchong, could you share the companies that have high EBIT/EV>Earning yields and EBIT/(NET fixed assets+ net working capital>ROC.
As explained by Joel GreenBlatt in the book,
Using EBIT/EV is to find a cheap stock
Using EBIT/(Net fixed assets+ Net working capital) is to evaluate whether the company can generate good profits using capital.
In short,the investors can find a cheap stock with good quality business(fundamentals) using the magic formula.
I would also like the companies that can generate high FCF or High CFFO with little spending on Capex? I dont mind even though its profit is growing slowly.hahaha.
2014-01-12 00:14
Hi. Anyone has views on DKSH? Have seen its price rise from RM2+ slightly over a year ago to present level. Maybe a good and cheaper proxy to the consumer products sector?
2014-01-12 05:52
An investment approach based on solid value is the most dependable.
Posted by houseofordos > Jan 11, 2014 08:01 PM | Report Abuse
KC, I got about same number as you for EPV method. Just wondering how would you adjust the valuation if a company has issued warrants or convertible stock which could dilute shareholder EPV ?
A very good question. Let’s discuss here.
For simplicity, I would think you just consider the enlarged number of shares as if the warrants are converted to the underlying share. Don’t forget to add the amount of cash used for conversion to the balance sheet. This may be quite close if the warrants are deep in-the-money and expiry is not too long in the future.
However, for warrants which are out-of-the-money, we don’t really know if conversion will take place. I would use the Black-Scholes Option Pricing to determine the price of the warrants, then multiply by the number of warrants outstanding to get the amount due to warrant holders. This amount is subtracted from the EPV value of the underlying.
Hope to get input from others.
2014-01-12 09:01
Hi Kcchongnz & digiuser016, I think currently the co im looking at most have been covered by kcchongnz, such as cenbond, kfima, mfcb or homeriz. Some others high on ROC are Magni-Tech which I kinda like at the moment; Fibon, Pestech & Mudajaya looks attractive although I haven't look at the ROC consistency, only the most recent year. SKPRes is the gorilla.
2014-01-12 11:26
Digiuser016:
My personal evaluation:
I think I first considered kfima 2 years ago when kcchongnz first wrote about it. I do not particularly like the government-handed part of the biz of kfima.
Cenbond's results had been meodiocre till last year or so, and 70% of its biz is derived in Malaysia (which should be tough in coming years)- as opposed to overseas market.
Both companies sit on good cash pile, but its dividend is small. The current valuatioin is fair for both companies, not cheap. Hence, little upside.
2014-01-12 13:18
Katsenelson’s absolute PE for CENBOND (12/1/14)
Instead of using the relative PE valuation method for different industry, Vitaliy created an absolute and more robust method that can be used for any company. The absolute P/E model makes adjustment according to the following:
• An average company that does not grow earnings and pays no dividend, use PE=8
• For every unit of earnings growth from 0-16%, P/E increases 0.65 points, above 16% growth, use 0.5 points. Earnings growth is based on 5 years projection.
• Every percent increase in dividend yield, P/E increase by 1 point
• Adjust P/E according to business , financial risks and earnings visibility
For those who are interested in this method can refer to the following link:
http://klse.i3investor.com/blogs/kianweiaritcles/36512.jsp
Last year, net income of Cenbond grew by 32% from 15.5m to 20.6m. For the last 7 years the compounded annual growth rate has been 12.4%. For adjusting the absolute PE, we take half the rate as a conservative assumption, or a growth of earnings of 6.2%.
Basic PE for CENBOND with a growth of 6.2% and a dividend yield for last year of 2.6% is adjusted by the formula;
Basic PE = 8 + 0.65*6.2 + 2.6 = 12.8
Business risk: CENBOND’s business has high efficiencies with return of assets of 9.7% (>7%) and return of equity of 12.7%. Last year cash return (FCF/IC) is at 37% and average of last 7 years is 16%. Hence an arbitrary 10% discount is applied to its business risk.
Financial risk: CENBOND has a very healthy balance sheet with an excess cash of 64 sen per share. It has very little debt. Current ratio is very high at 4.3. Free cash flow is abundant at 7 times total debt. Hence a discount of 10% is applied to the financial risk.
Earnings visibility: CENBOND has stable and reasonable gross and net profit margin of 20% and 10% respectively. Its cash flow from operations averages about 140% of its net income. It has average free cash flow of about 8% of revenue. No premium or discount is applied to earnings visibility.
Hence the absolute PE for CENBOND is:
Abs PE = 12.8* [1+(1-90%)] *[1+(1-90%)] * [1+(1-100%)] = 15.5
Fair value of CENBOND= 15.5*0.16 = RM2.48
There is hence a 44% upside to its present share price of 1.72 on 12 January 2014.
2014-01-12 16:34
Acquisition of shares by Director - off market transaction 09/01/2014 - 411,500 @ 1.430 !! What does it mean ???
2014-01-14 19:44
Wow. I thought I knew a lot about stocks until I stumble upon your article. I should retreat to my humble cave and study more.
2014-05-08 17:56
Post a Comment
Featured Posts


Latest Videos


Apps


Top Articles
1
Dragon Leong blog
2
Stock Market Enthusiast
Feng Shui Market Outlook for FBM KLCI in the Year of the Wood Snake (2025)
3
Stock Market Enthusiast
3 Resilient Stocks That Defied Malaysia’s Market Slump in January 2025 - #GCB, #ABMB, #CDB
4
The Alpha Trader
5
Kenanga Research & Investment
Oil & Gas - Dissecting Petronas and Trump's Impact on the Sector (OVERWEIGHT)
6
Rakuten Trade Research Reports
7
TA Sector Research
8
MQ Market Updates
#
Stock
Score
Daily Stocks
Stock Name
Last
Change
Volume
Stock Name
Last
Change
Volume
Stock Name
Last
Change
Volume
Featured Advertisers / Partners


Ride The Bull Short The Bear
CS Tan
4.9 / 5.0
This book is the result of the author's many years of experience and observation throughout his 26 years in the stockbroking industry. It was written for general public to learn to invest based on facts and not on fantasies or hearsay....
Najib Zamry
KC ChongNZ, I can't find fault with your pick, not even one. Good recommendation.
2013-12-31 13:56