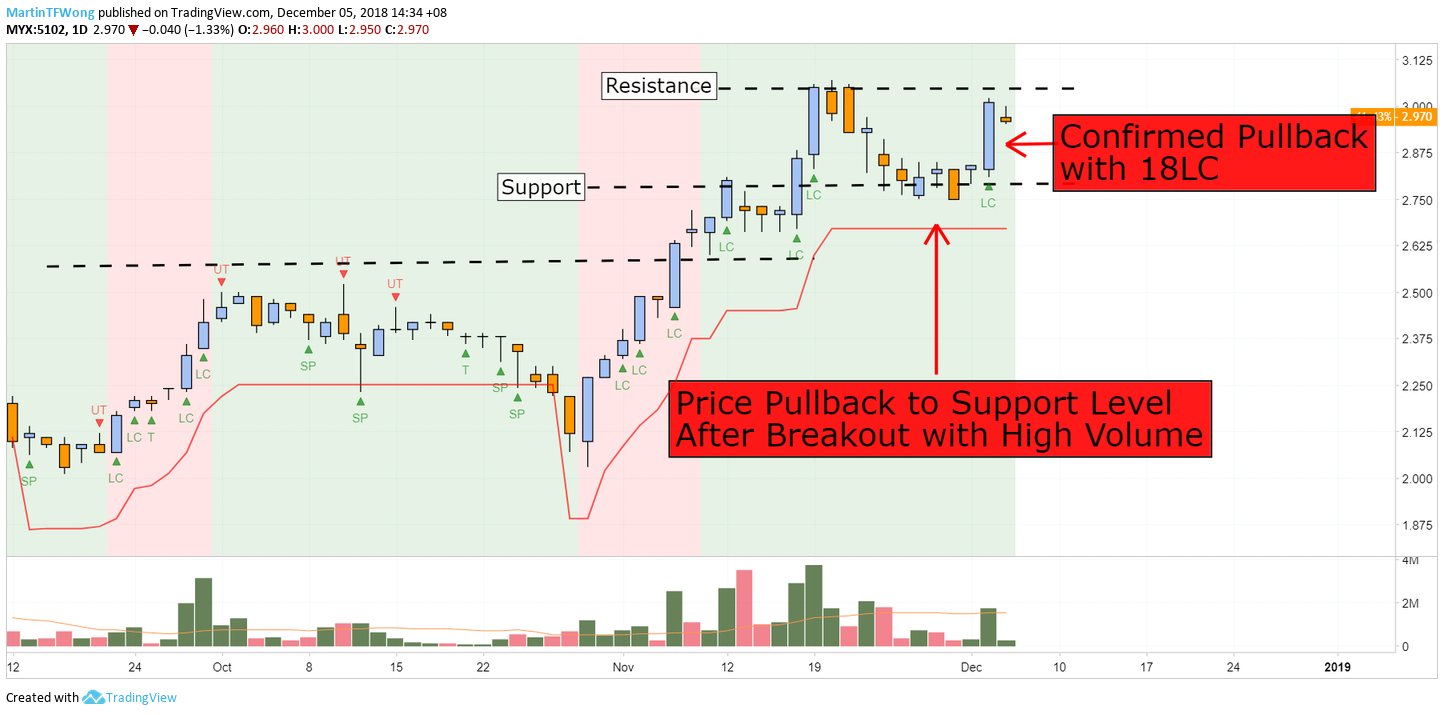
Guan Chong (5102.KL) Completed Pullback Pattern
TradeVSA
Publish date: Wed, 05 Dec 2018, 02:54 PM

Yesterday, we do share about how Pullback Pattern form using Revenue daily chart. You can refer to the URL link below for Revenue post on the Pullback Pattern:
https://klse.i3investor.com/blogs/tradevsa_stock_ideas/185165.jsp
Currently, Guan Chong is forming a similar pattern and the Pullback just completed on 4 December 2018. Notice there is no Sign of Weakness in the recent bars indicating Smart Money yet to distribute the stock. The confirmation from this Pullback gave traders another opportunity to trade with lower risk. Do note that the background based on the daily chart is still strong. Read the post below as we spotted Guan Chong in October 2018
https://klse.i3investor.com/blogs/tradevsa_stock_ideas/177965.jsp
Stop Loss = $2.74
1st Target = $3.15
2nd Target = $3.30
Send us your preference stock to review based on TradeVSA chart by comment at below. We will post the chart with comment at www.facebook.com/MartinTFWong
Interested to learn more?
· FREE Webinar, 9 December (Sun), 2pm: https://bit.ly/2PwmviH
· Visit our website for FREE Stock Screener: https://tradevsa.com/
· Contact us via: email at support@tradevsa.com or Call/WhatsApp at +6010 266 9761
Disclaimer
This information only serves as reference information and does not constitute a buy or sell call. Conduct your own research and assessment before deciding to buy or sell any stock.


ksng0307
Never buy near resistance, you buy you die
2018-12-05 15:32