


TradeVSA - Stock Trade Ideas
AirAsia Group: Heading to the Resistance ?

TradeVSA Weekly Chart
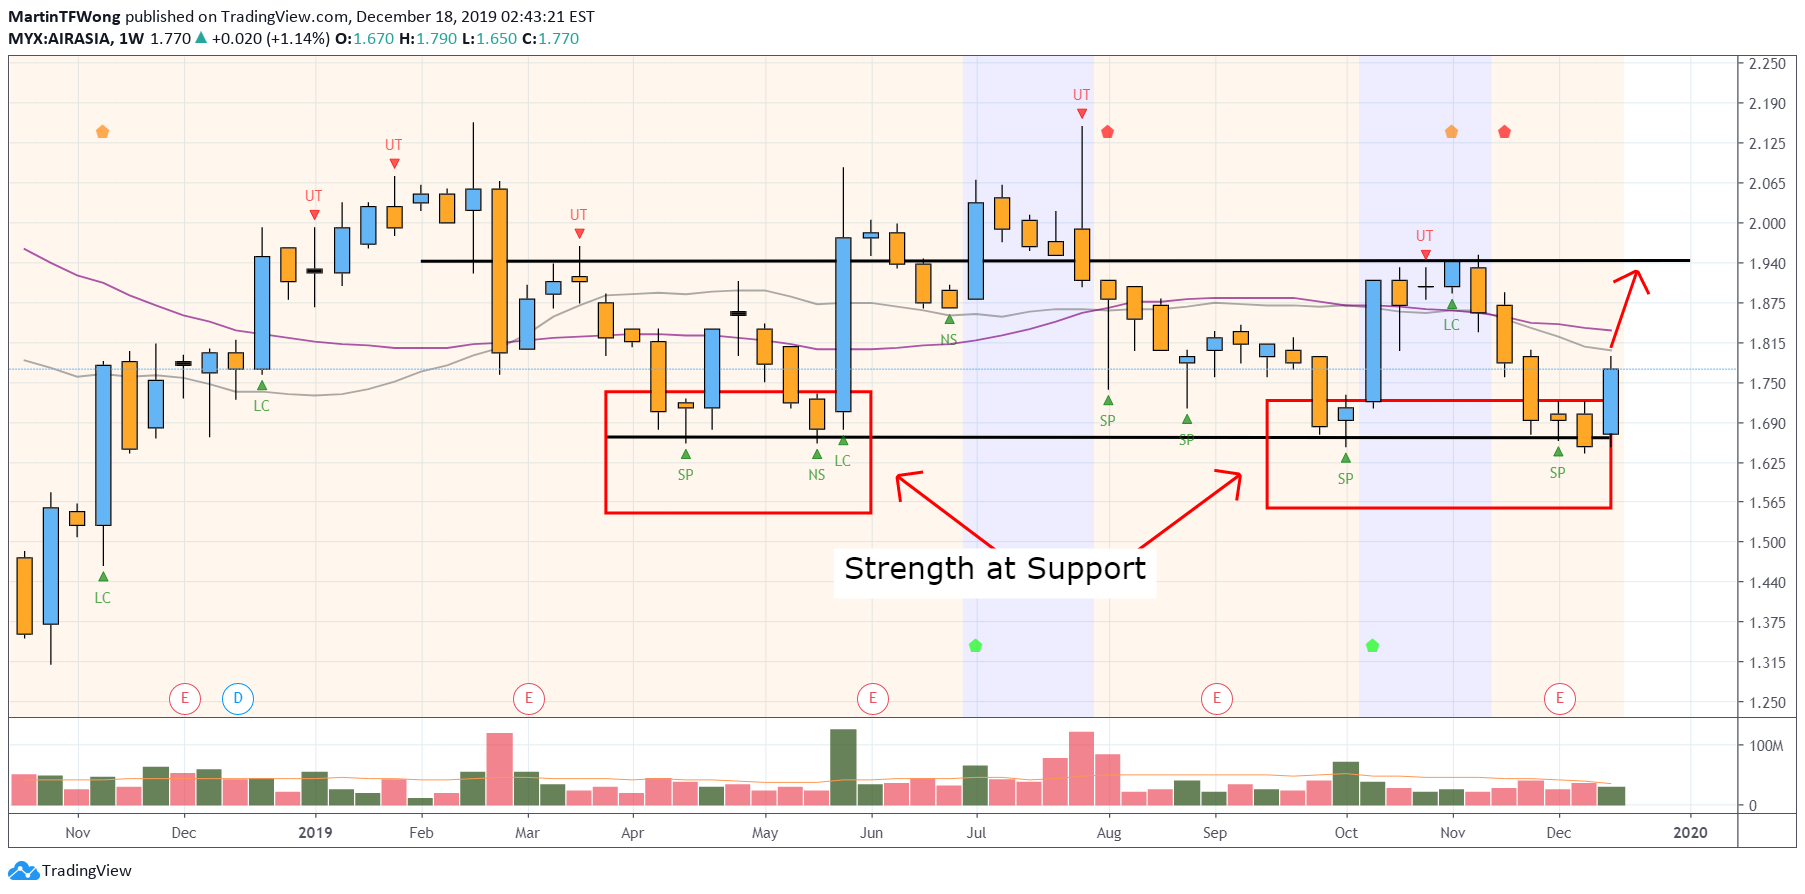
Strength in the chart:
- Lots of Spring bar at support to remove weak-holders
- Price try to close above Spring bar again
- Potential to re-test resistance at RM1.94
TradeVSA Daily Chart
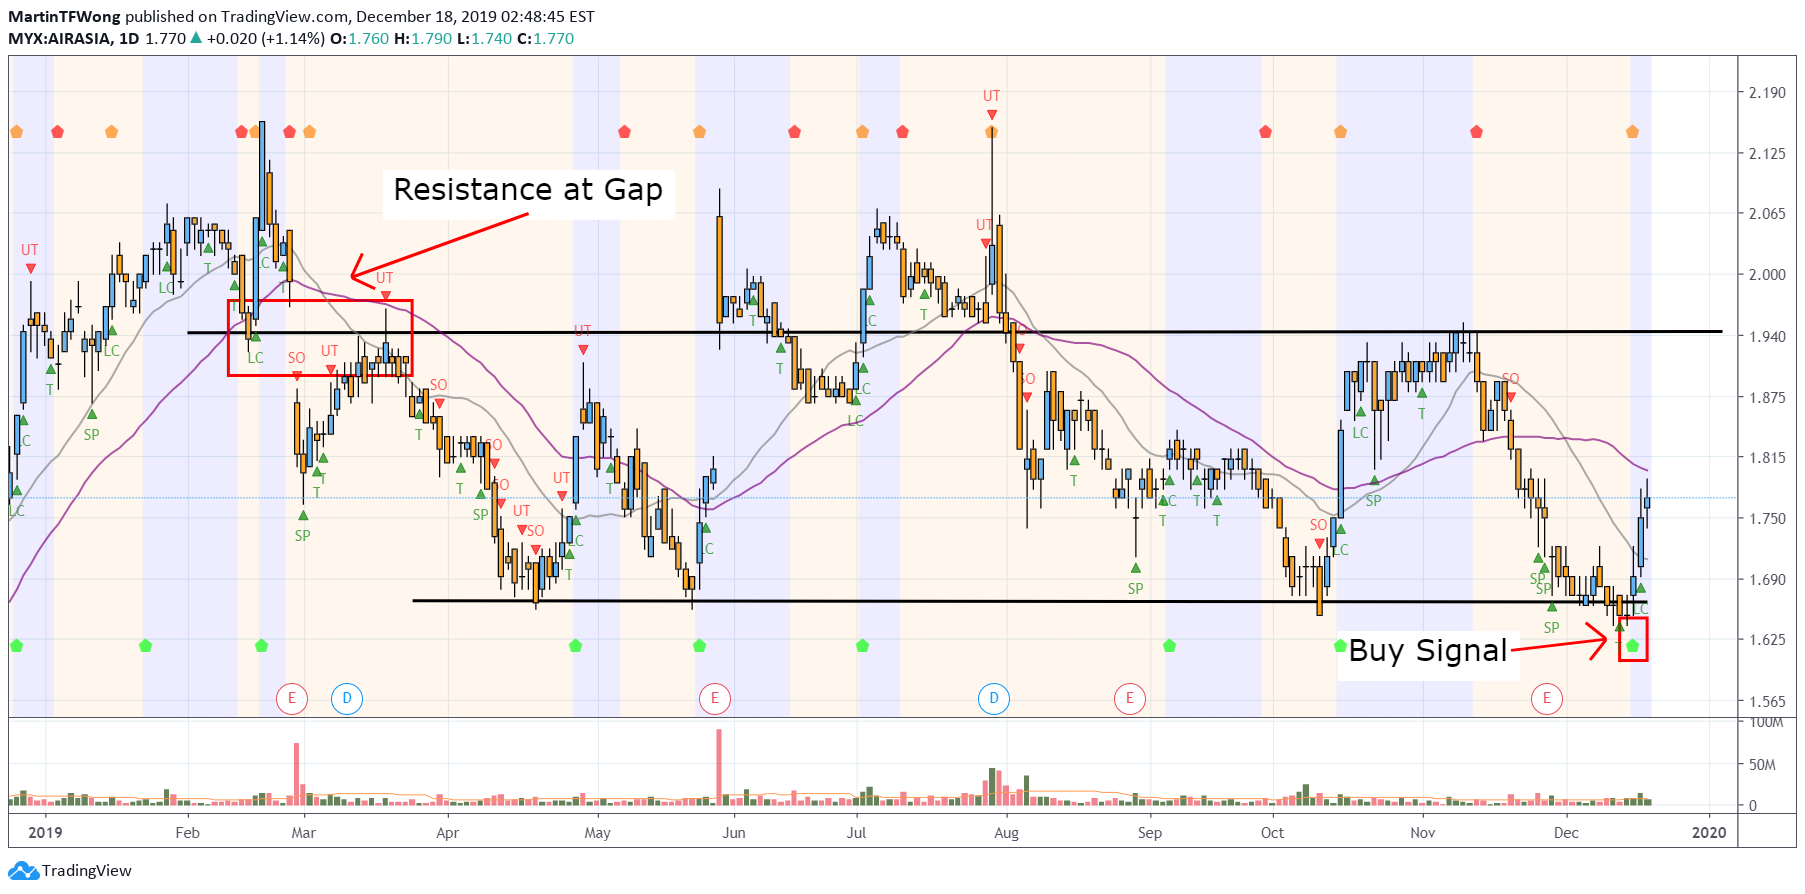
Strength in the chart:
- Huge resistance with Gap & Up-Thrust bar
- Bullish buy signal appeared again on 16 December 2019
- Another potential +9% to hit resistance
TradeVSA Hourly Chart
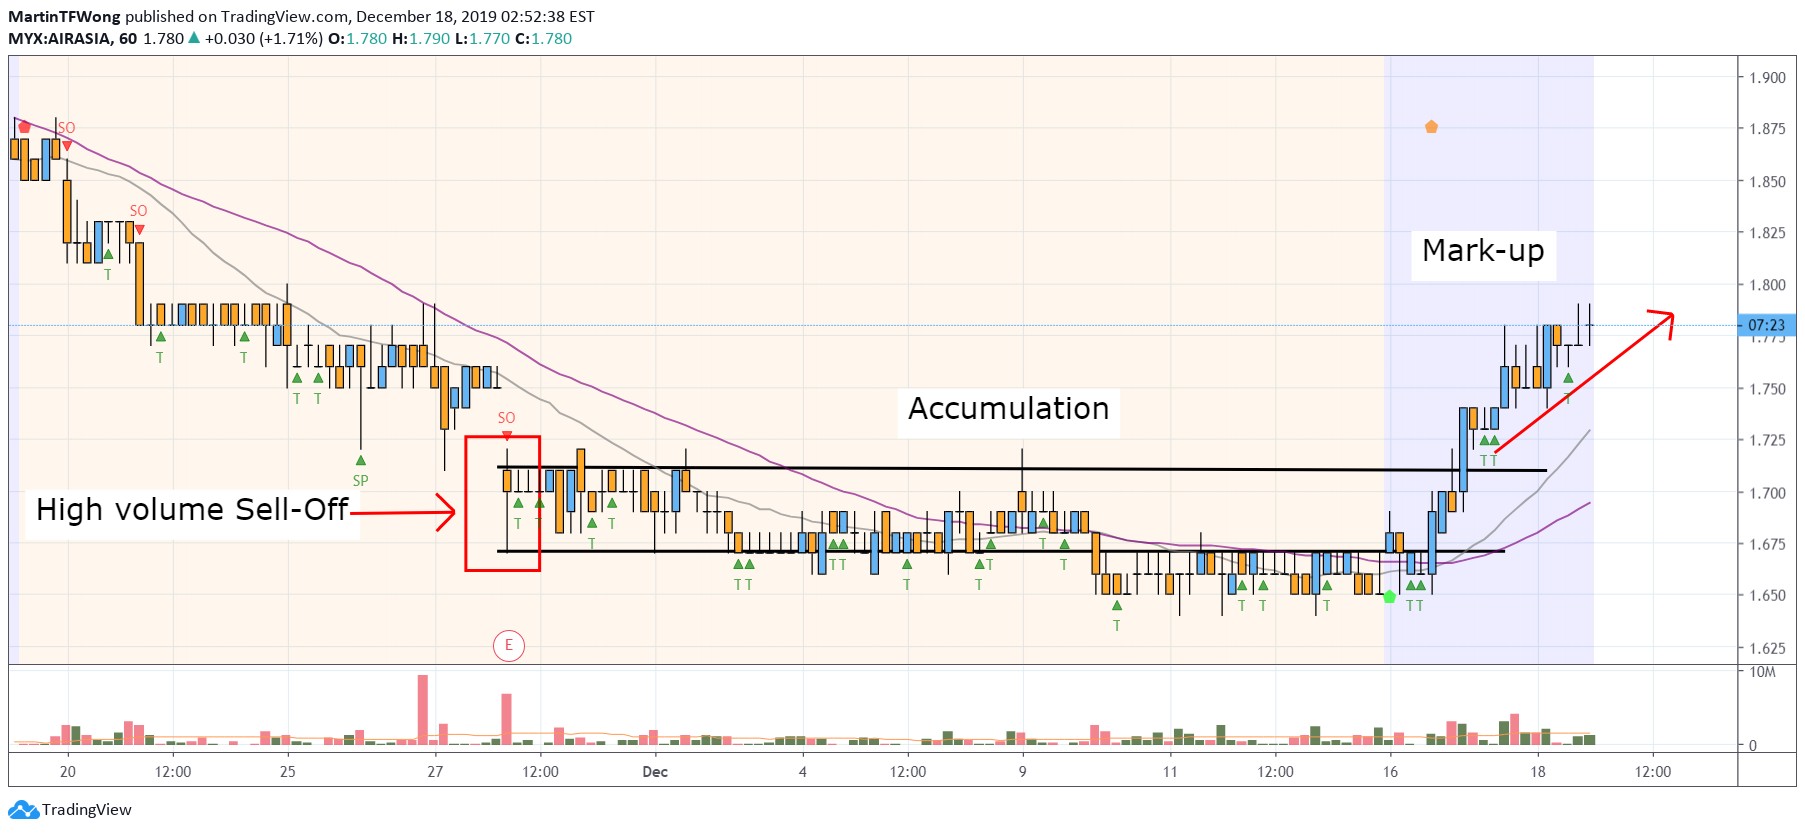
Strength in the chart:
- High volume sell-off bar changes the direction of the market stages
- Accumulation with shakeout
- Mark-up stage with no weakness
Watch the video below for more details about AirAsia using Volume Spread Analysis:
17 December 2019
Contact us via: email at support@tradevsa.com or Call/WhatsApp at +6010 266 9761 if you have any queries.
Join our FREE Education via Telegram Channel: https://t.me/tradevsatradingideas
Facebook: www.facebook.com/MartinTFWong
Related Stocks
| Chart | Stock Name | Last | Change | Volume |
|---|
More articles on TradeVSA - Stock Trade Ideas
Discussions
Be the first to like this. Showing 1 of 1 comments
Post a Comment
Featured Posts
Introducing MY's First IPO Fund for Sophisticated Investors!
New Update. Discover investment communities that resonate with your ideas
M & A Value Partners IPO Equity Fund has been launched - Targeted 13% Return p.a
Latest Videos


Apps


Top Articles
1
2
4
save malaysia!
Visa-free travel to China extended for Malaysians to 30 days
5
6
7
BFM Podcast
8
#
Stock
Score
Daily Stocks
Stock Name
Last
Change
Volume
Stock Name
Last
Change
Volume
Stock Name
Last
Change
Volume
Featured Advertisers / Partners


Ride The Bull Short The Bear
CS Tan
4.9 / 5.0
This book is the result of the author's many years of experience and observation throughout his 26 years in the stockbroking industry. It was written for general public to learn to invest based on facts and not on fantasies or hearsay....
KAQ4468
cantekkkkkkkk
2019-12-19 20:24