


VC Education Series
Understanding Fibonacci Retracement: A Powerful Tool for Trading Support and Resistance Levels

Have you ever wondered how experts forecast currency trading market ups and downs? In this blog, we’ll learn about a fascinating tool for forex trading known as Fibonacci retracement.
What is Fibonacci retracement?
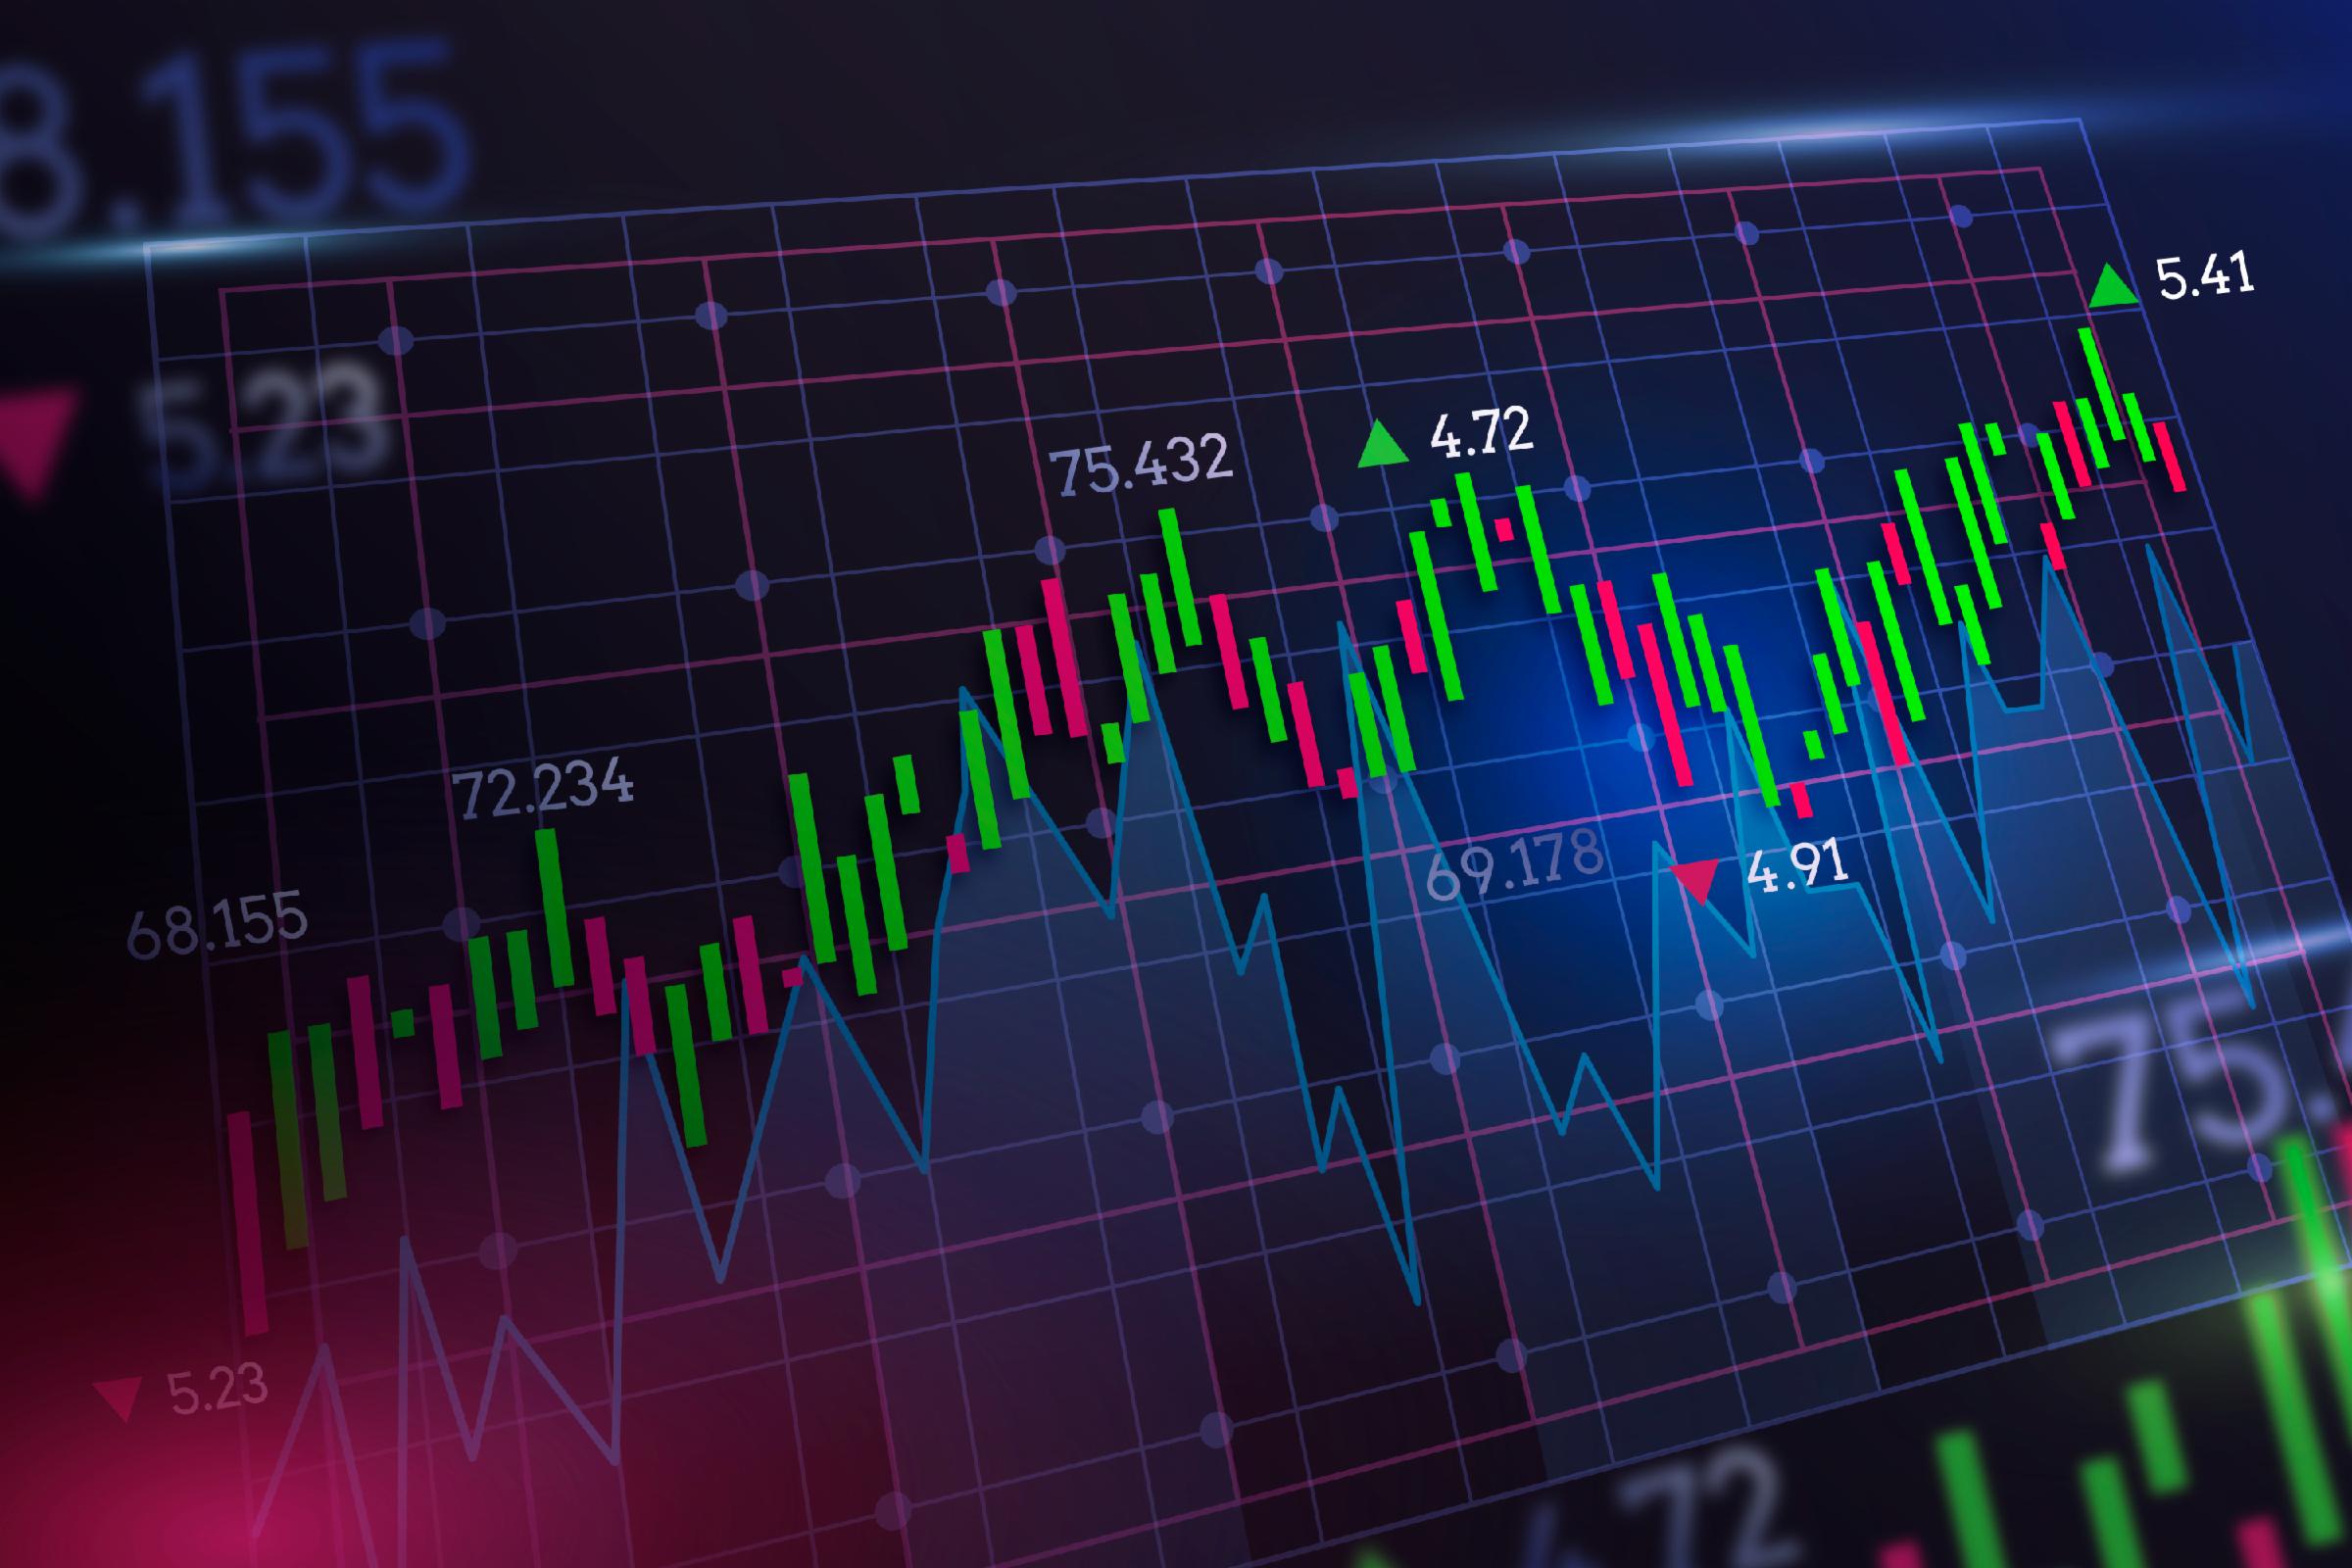
Fibonacci retracement is a unique technique that helps traders identify important market levels. It's similar to using clues to uncover hidden treasures! Traders draw lines on a chart to indicate potential levels where the price may bounce back or continue in a specific direction.
How does it work?
Think of a bouncing ball. When it goes up and down, it rarely goes straight up or straight down. It pauses and retraces its steps before continuing on its journey. The same thing happens in forex trading. The price of a currency may rise or fall but pauses and retraces before continuing.
Fibonacci retracement uses specific percentage levels derived from the Fibonacci sequence to identify potential price levels where a market might reverse or continue its trend. The key Fibonacci levels most commonly used are 38.2%, 50%, and 61.8%.
How to Use Fibonacci Retracement
When the price of a currency is trending, we look for retracement levels to see if the trend will reverse or continue. It's like looking for hints to predict the next price.
Identify the Trend: Before using Fibonacci retracement, it's important to identify the trend in the price of a currency. Determine if the trend is upward (bullish) or downward (bearish). This will help you know whether to apply Fibonacci retracement for potential buying opportunities in an uptrend or selling opportunities in a downtrend.
Select the Swing Points: Choose the significant swing points on the chart. A swing point is a high or low point in the price that marks a change in direction. In an uptrend, select the lowest swing point as the starting point, and in a downtrend, select the highest swing point.
Draw the Fibonacci Levels: Draw the Fibonacci retracement levels on the chart using the selected swing points. The most common levels are 38.2%, 50%, and 61.8%. These levels indicate potential support and resistance areas where the price may reverse or continue its trend. You can also include additional levels such as 23.6% and 78.6% for more reference points.

Fibonacci in VC Plus. Sign up for free now.
Analyze Price Reactions: Pay attention to how the price reacts to the Fibonacci levels. Observe how the price reacts to the Fibonacci retracement levels. If the price retraces (pulls back) to one of these levels and then bounces off it, it suggests that the level is providing support or resistance. This can indicate potential entry or exit points for trades.
Confirm with Other Indicators: While Fibonacci retracement can be a useful tool, it's always recommended to confirm its signals with other technical indicators or chart patterns. Look for convergence or agreement between Fibonacci levels and other indicators like trendlines, moving averages, or candlestick patterns. When multiple indicators align and confirm the same price level, it increases the likelihood of a successful trade.
Practice and Refine: Like any trading tool, using Fibonacci retracement requires practice and experience. Start by applying it to historical price charts to see how the levels align with price movements. As you gain more familiarity, you can incorporate it into your live trading strategy, adapting it to different timeframes and currency pairs.
Combining with Other Indicators
To improve the accuracy of our predictions, we combine Fibonacci retracements with other tools such as trendlines or moving averages. It's like putting different puzzle pieces together to get a better picture.
Verdict
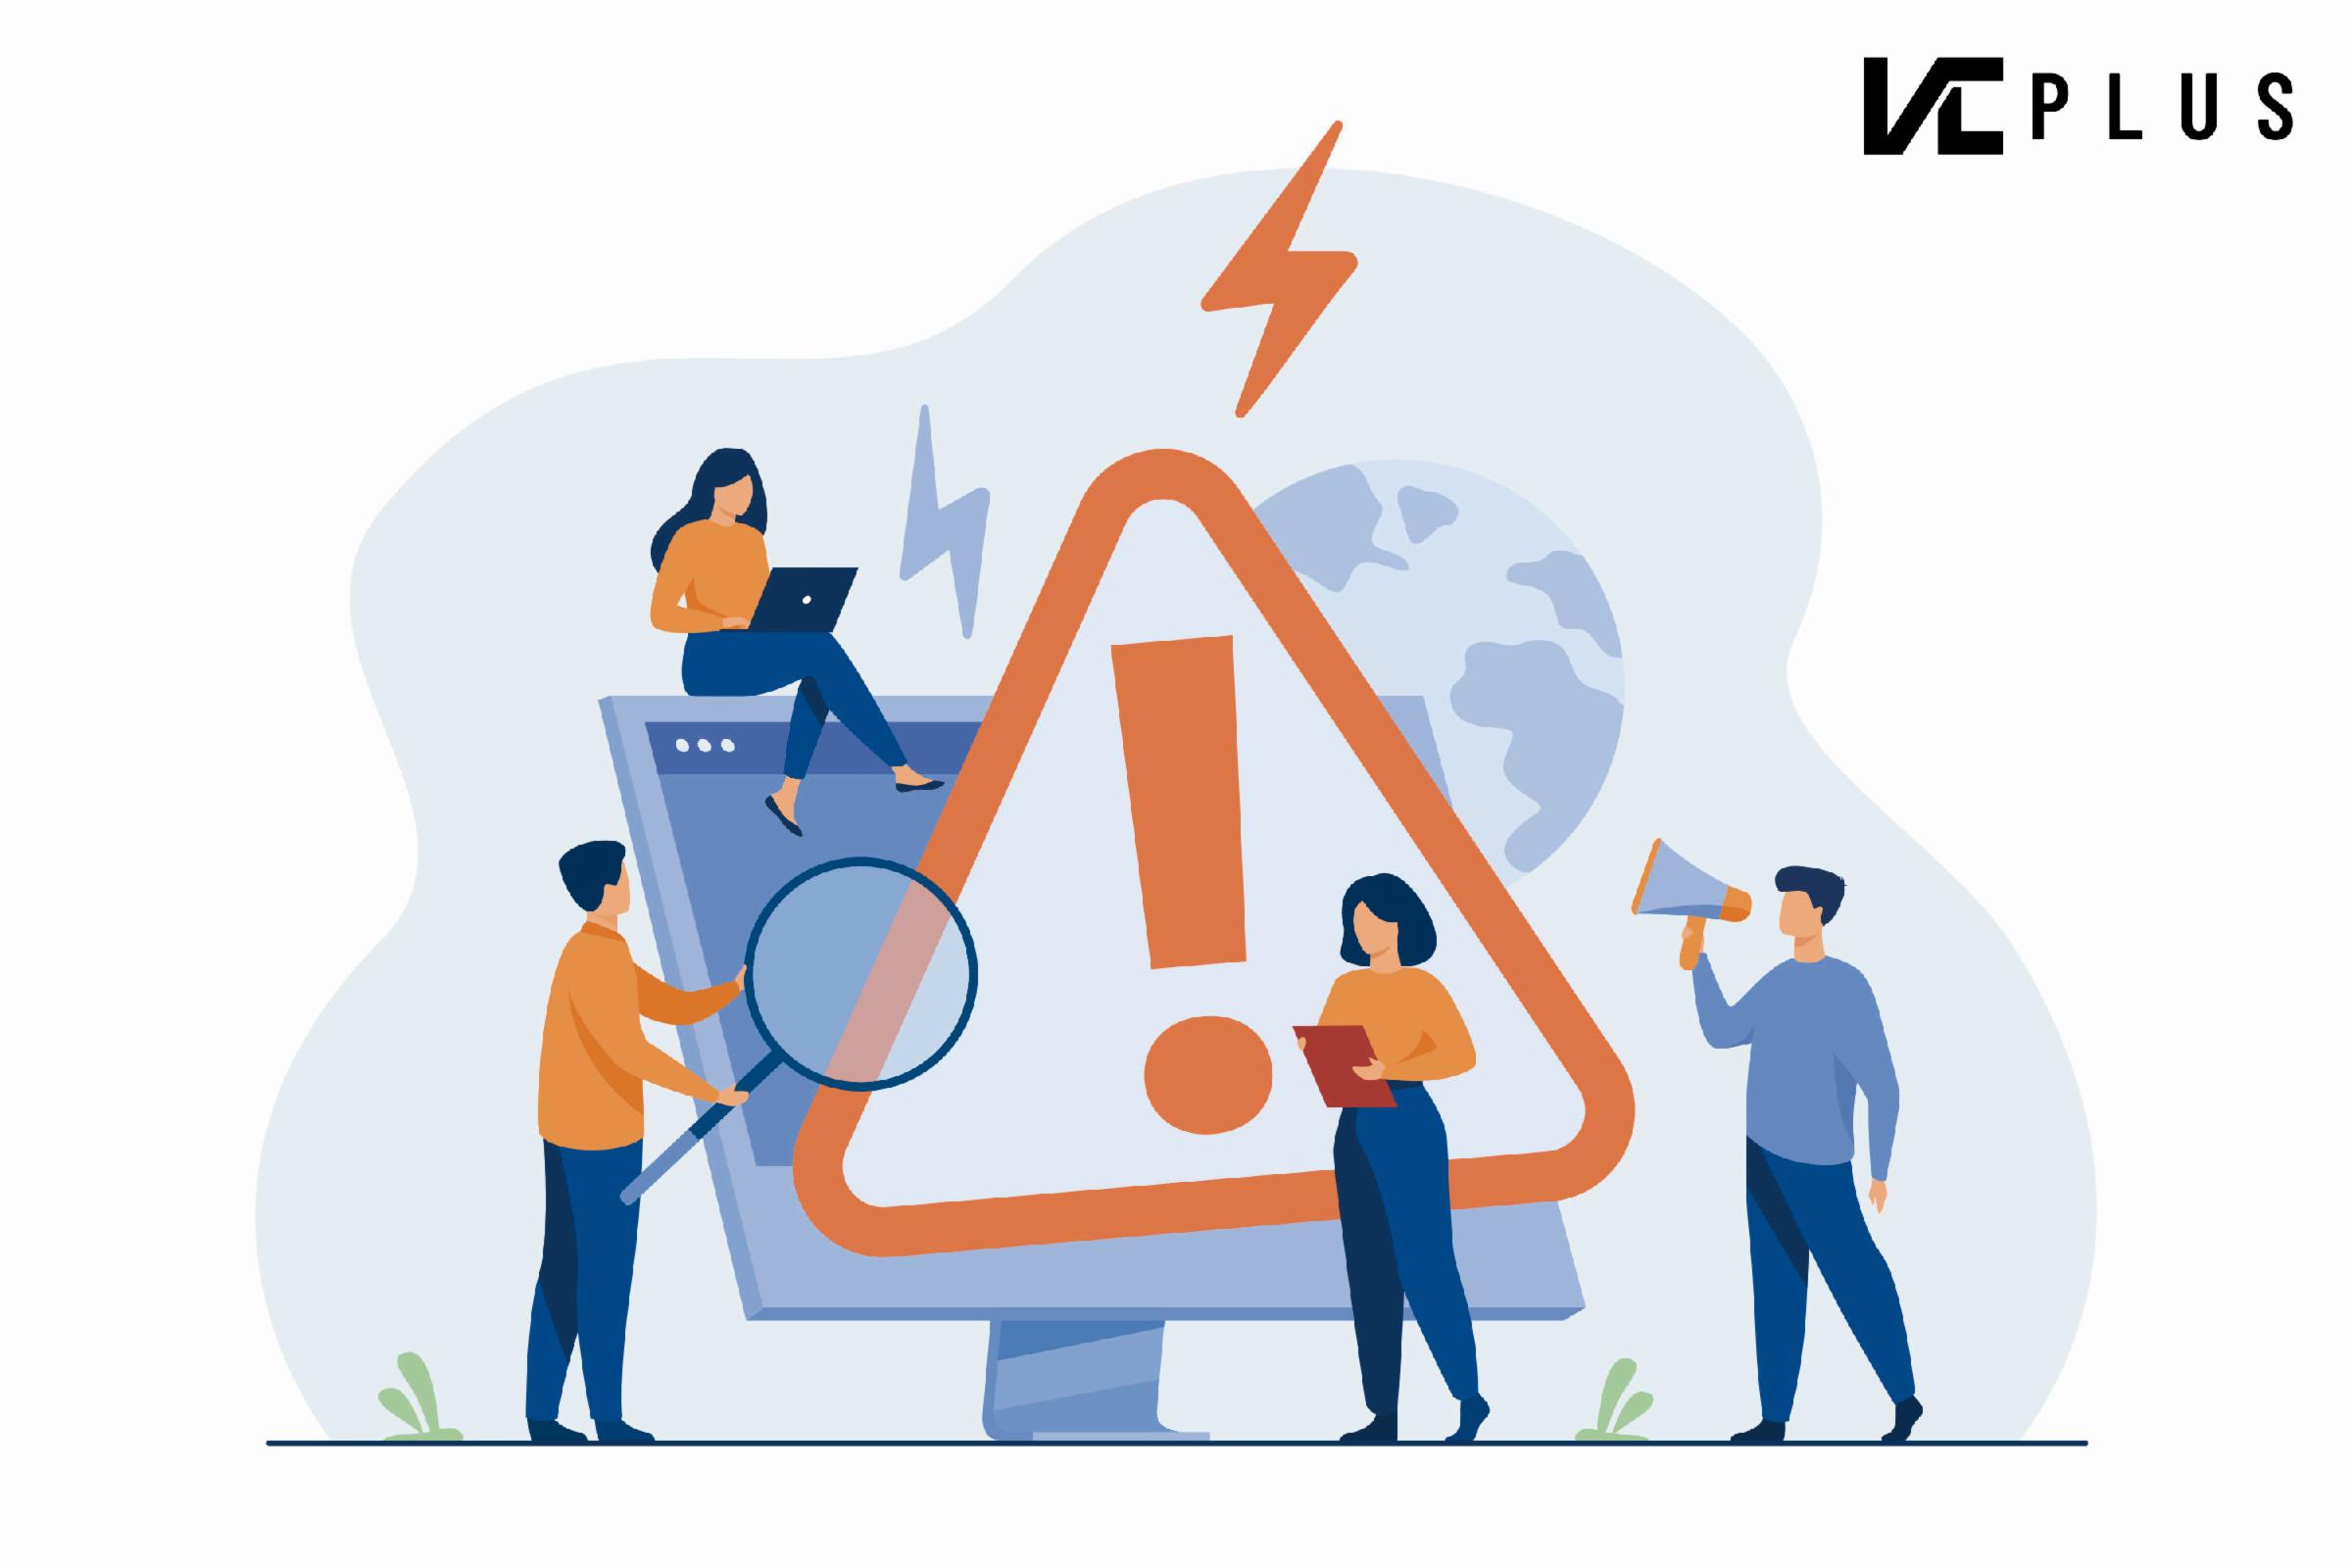
Like finding hidden treasures using clues, Fibonacci retracement helps us predict potential price levels in forex trading. However, it's important to note that Fibonacci retracement is not a foolproof trading strategy. It should be used in conjunction with other analysis techniques and risk management strategies. Market conditions can sometimes cause price movements to deviate from the Fibonacci levels, so it's essential to consider the broader market context.
Continue reading more about What is fundamental analysis in forex

Open a Forex account with VC Plus today, and grab a guaranteed US100$ Welcome Bonus (T&C apply)
VC Plus provides a demo account. Therefore you can try it before you begin your actual trade!
More articles on VC Education Series
The Trajectory of the US Dollar Index (DXY) and Its Underlying Logic
Created by vcplus | Nov 23, 2023
Discussions
Be the first to like this. Showing 0 of 0 comments
Post a Comment
Featured Posts


Latest Videos
.png)


Apps


Top Articles
1
2
AmInvest Research Reports
3
Rockstone Investment
Binastra Corp Bhd – A Promising Investment in Construction in 2025
4
save malaysia!
5
8
CEO Morning Brief
China Probes Calvin Klein Parent Over Suspected Xinjiang Boycott
#
Stock
Score
Daily Stocks
Stock Name
Last
Change
Volume
Stock Name
Last
Change
Volume
Stock Name
Last
Change
Volume
MQ Trading Signals
Stock
Time
Signal
Duration
Stock
Time
Signal
Duration
Featured Advertisers / Partners


Ride The Bull Short The Bear
CS Tan
4.9 / 5.0
This book is the result of the author's many years of experience and observation throughout his 26 years in the stockbroking industry. It was written for general public to learn to invest based on facts and not on fantasies or hearsay....