


4Dview
iCapital.biz Matching Scottish Mortgage Investment Trust PLC (SM)?

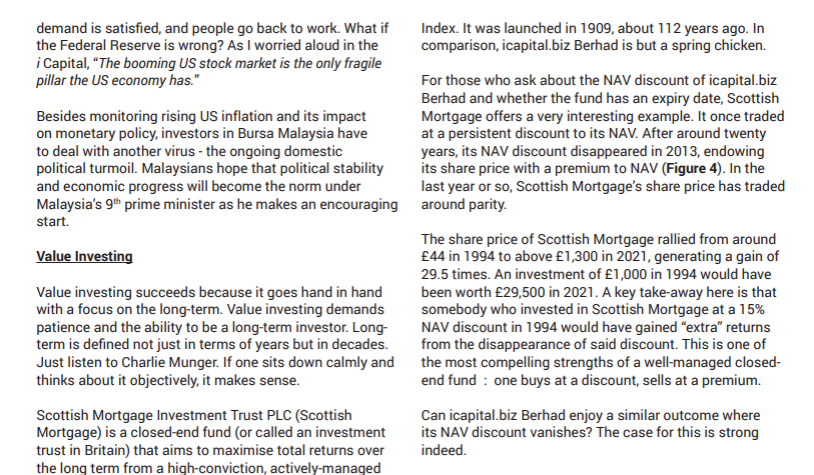
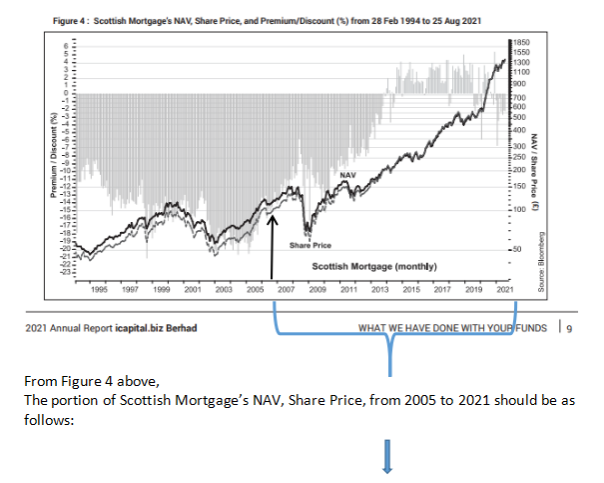
Shareowners’ attention is directed to pages 9 and 10 of iCapital.biz Bhd’s 2021 Annual Report, in particular Figure 4 on page 9 and Figure 5 on page 10.
Below is page 9:-
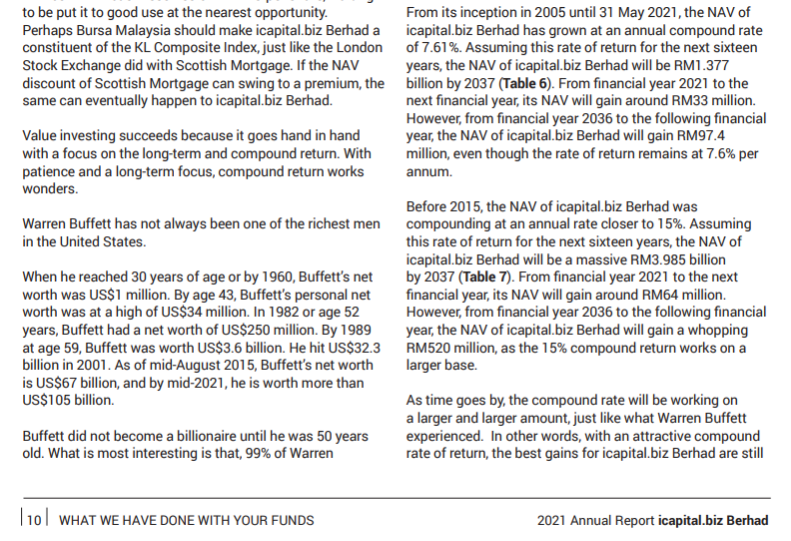
Below is page 10:-
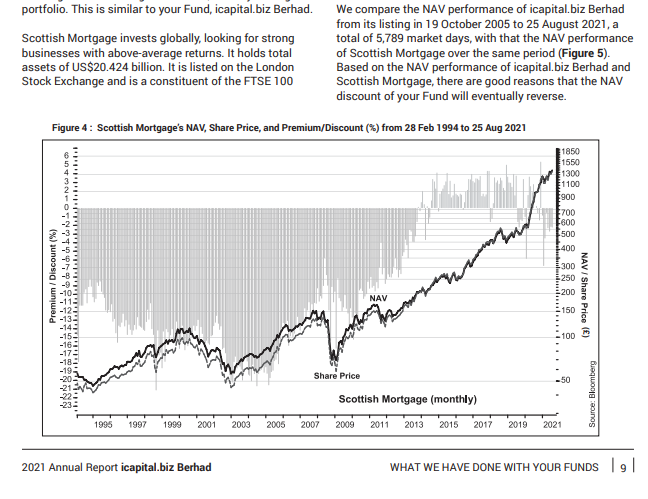
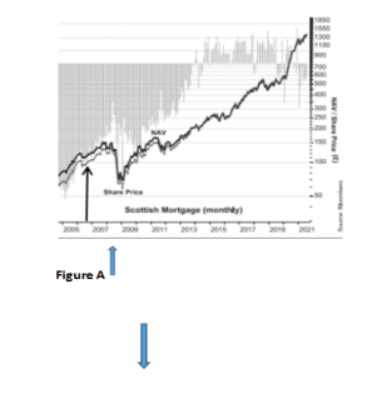
Zooming in to Figure 4 at the bottom of page 9, we get the following:-
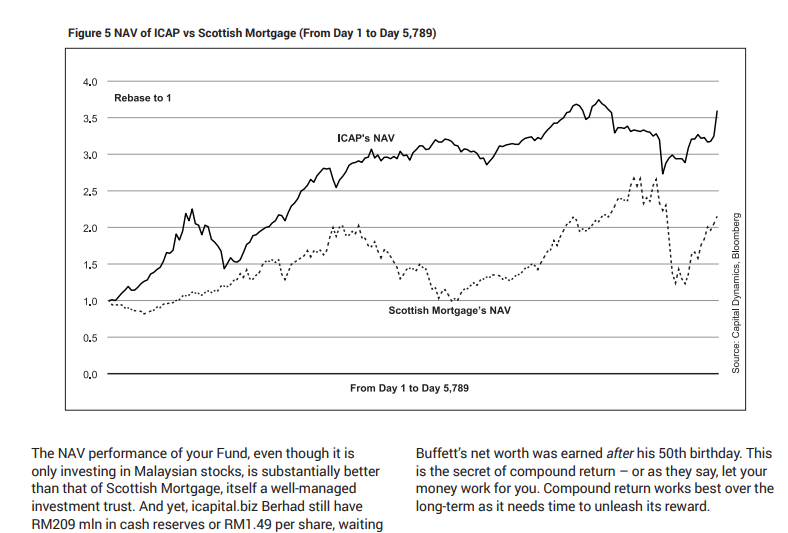
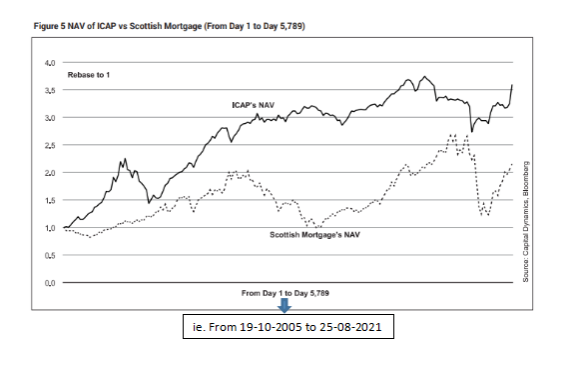
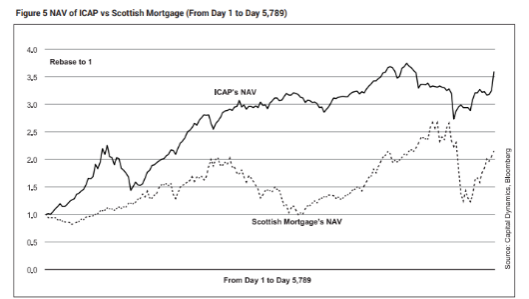
Compare the above graph with the dotted line graph below in Figure 5.
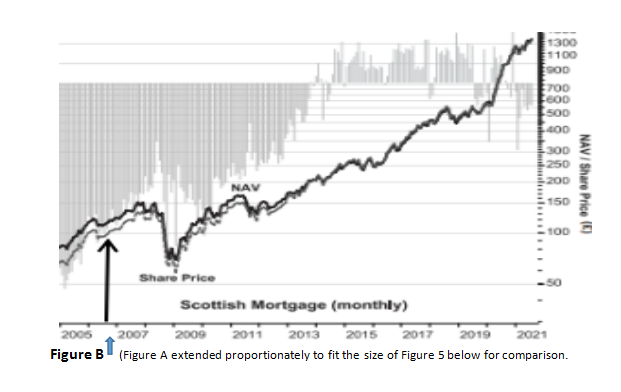
A casual glance will suffice to see that the Scottish Mortgage’s NAV graph in Figure B is so much different from the dotted line graph put up by iCap in Figure 5.
Figure 5 gives the impression that iCap’s NAV performance is superior than Scottich Mortgage’s over the whole period from 2005 to 2021 (5,789 days). This is an illusion to some readers who are not well verse with graph presentation. This type of illusion springs from the use of 2 y-axis for 2 graphs which have different ranges of value. It is legitimate to present in this way even though it is misleading.
The misfeasance is the omission of the secondary y-axis which is the range of Scottish Mortgage’s price which should appear on the right hand side of Figure 5 above. Without that, you cannot tell what is the range of price for Scottish Mortgage. And if you base it on the left hand side NAV, Scottish Mortgate only has a range of NAV from 1 to less than 3 which is totally different from the graph shown in Figure B or Figure 4. How the dotted line graph of Scottish Mortgage’s NAV has been derived by iCap in Figure 5 surely need to be announced by iCap to its shareowners!
Now since Scottish Mortgage is a publicly listed investment trust, I decided to search for its price for the period 2005 to 2021 and plot a graph myself to see what is the outcome!
Below are two screen shots of Scottish Mortgage’s price as at 23-10-2005 and 13-10-2021 respectively taken from Yahoo!Finance. To save space, for prices at other dates, you may check at Yahoo!Finance interactive chart or other site such as Bloomberg.
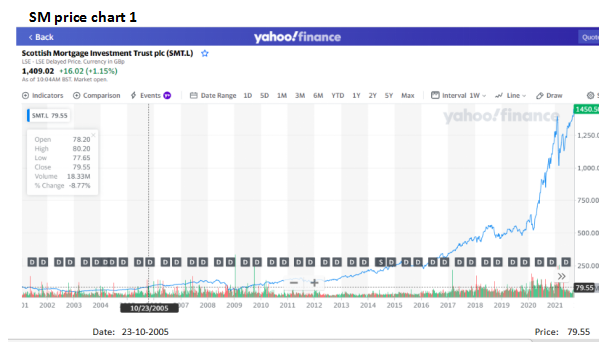
As at 23-10-2005, the price was 79.55 pence (or £0.7955). (Note: the price is in pence and not in £ as stated in iCap 2021 Annual Report. Again, for a world class fund manager, this is a low-level error).
Since £1 = 100 pence, to get the value in £, just divide the value in pence by 100.
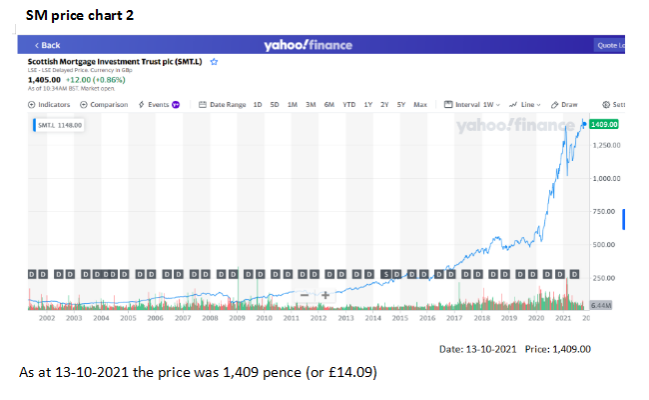
As at 13-10-2021, the price of Scottish Mortgage is 1,409 pence or £14.09.
(P/S Price of Scottish Mortgage as at 15-11-2021 is 1,500.50 pence or £15.)
Below I have reworked the graphs for comparing iCap’s NAV to Scottish Mortgage’s price in three methods to show the difference in presentation look of the graphs.
Method 1
Figure C below are two graphs plotted with dual scales.
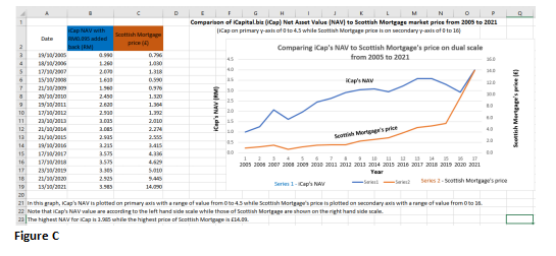
Figure C is split into two parts below to give greater visibility.
Part 1 of Figure C
Part 2 of Figure C
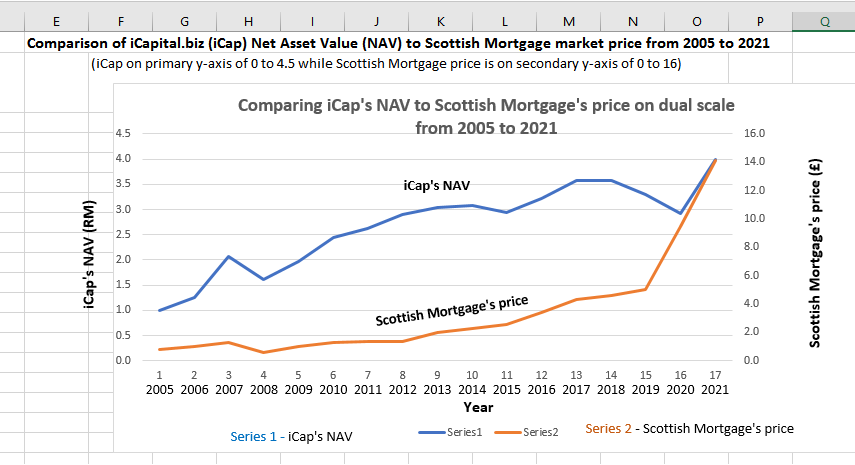
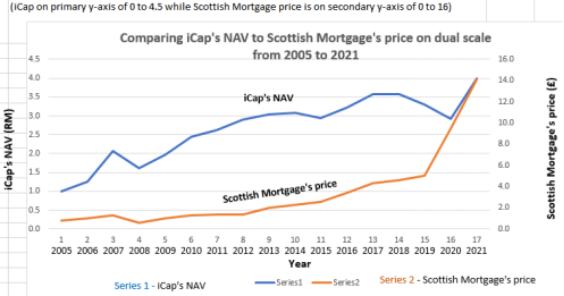
In this graph (Figure C), iCap's NAV is plotted on primary axis with a range of value from 0 to 4.5 while Scottish Mortgage's price is plotted on secondary axis with a range of value from 0 to 16.
Note that iCap's NAV value are according to the left hand side scale while those of Scottish Mortgage are shown on the right hand side scale.
The highest NAV for iCap is RM3.985 while the highest price of Scottish Mortgage is £14.09.
It appears that this method has been used by iCap in its Figure 5 on page 10 of its 2021 Annual Report. Adoption of this method is legitimate.
However, the misfeasance is :- it has failed to show the range of Scottish Mortgage’s price range on the right hand side of the graph. Further more the trend line of Scottish Mortgage’s price in Figure 5 of page 10 appears to be totally different from what I have plotted in Figure C using data from Yahoo!Finance price chart.
Method 2
Figure D below are two graphs plotted on single scale.
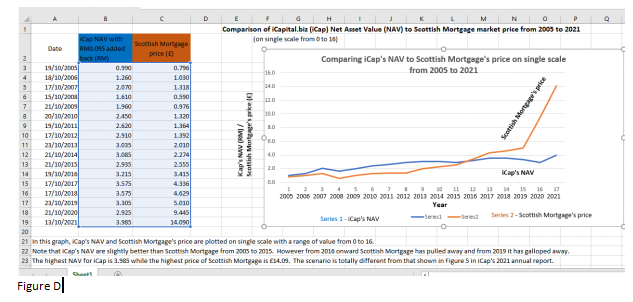
Figure D is split into two parts to give greater visibility.
Part 1 of Figure D

Part 2 of Figure D
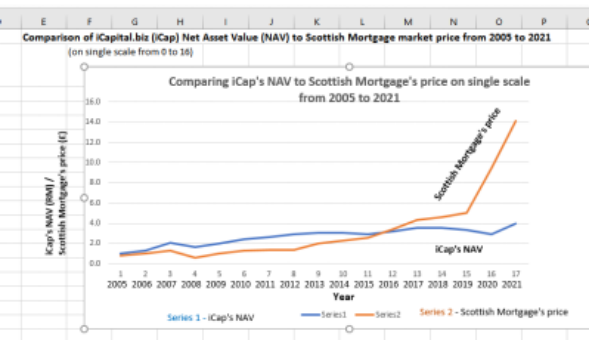
In this graph (Figure D), iCap's NAV and Scottish Mortgage's price are plotted on single scale with a range of value from 0 to 16.
Note that iCap's NAV performance was slightly better than Scottish Mortgage from 2005 to 2015. However from 2016 onward Scottish Mortgage has pulled away and from 2019 it has shot up dramatically. (Although this may not last).
The highest NAV for iCap is 3.985 while the highest price of Scottish Mortgage is £14.09.
The picture shown by my rework in Figure D is totally different from that shown in Figure 5 page 10 in iCap's 2021 annual report.
The question is why the graphs plotted based on published data show a less rosy picture as shown in iCap report? On what data has it based?
Method 3
Plot the graphs by adjusting the starting year’s value for both ranges from 1 as the base year equivalent.
Figure E below are graphs plotted using single scale and with Scottish Mortgage’s price in year 2005 taken as 1 so that the two graphs are compared on the same starting basis. iCap’s NAV in 2005 was RM0.99 which is almost equivalent to RM1. Therefore its values for other years need not be changed, the difference is negligible.
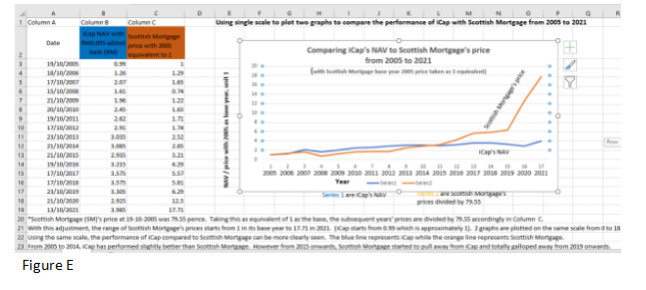
Figure E is split into 2 parts for greater visibility below.
Part 1 of Figure E
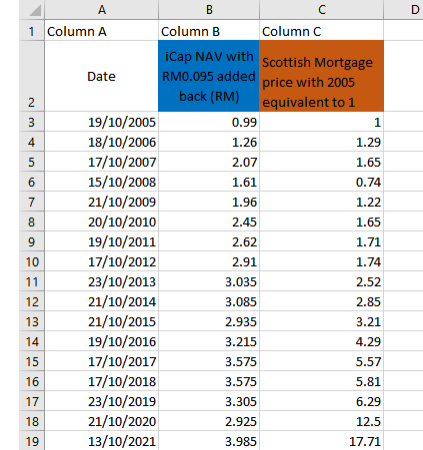
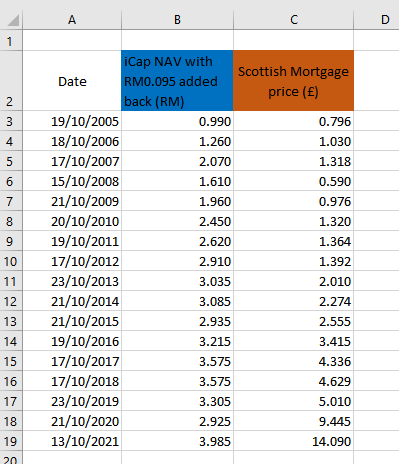
Scottish Mortgage (SM)'s price at 19-10-2005 was 79.55 pence. Taking this as equivalent of 1 as the base, the subsequent years' prices are divided by 79.55 accordingly in Column C.
With this adjustment, the range of Scottish Mortgage's prices starts from 1 in its base year to 17.71 in 2021. (iCap starts from 0.99 which is approximately 1).
2 graphs are plotted on the same scale from 0 to 18.
Part 2 of Figure E
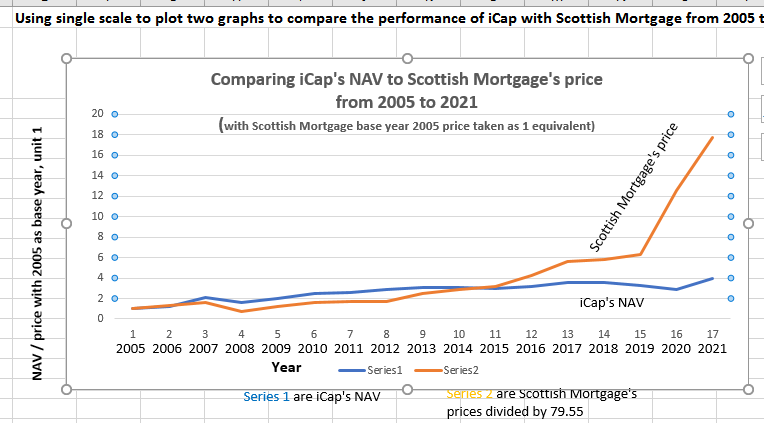
Using the same scale, and with Scottish Mortgage 2005 price adjusted to 1 as the base, the performance of iCap can be compared to Scottish Mortgage on the same footing.
The blue line represents iCap while the orange line represents Scottish Mortgage. Notice that the two line graphs start at the same point in 2005.
From 2005 to 2014, iCap has performed slightly better than Scottish Mortgage. However from 2015 onwards, Scottish Mortgage started to pull away from iCap and totally galloped away from 2019 onwards.
...................................
Of the three methods, method 2 (Figure D) and method 3 (Figure E)are suitable for comparing two series of values where the difference in their ranges are not too large.
In these methods, the difference between the two line graphs can be easily seen.
Method 1 (Figure C) is used if the difference in ranges of values is large. In this method the variations in the range of values of the smaller range can be more clearly seen. However it has a major disadvantage in that the appearance of the two line graphs will not show the actual comparison outright. The larger range (in this case Scottish Mortgage’s price in Figure C) is compressed and has to be “deciphered” by judging from the scale on the right hand side of the graphs.
Therefore even if Method 1 (Figure C) is chosen, the larger range of Scottish Mortgage’s price range has to be indicated on the right hand side of the graph (with iCap’s NAV range on the left hand side).
Failing to do so is misleading, to say the least.
In conclusion there are two discrepencies.
Discrepency 1
We compare Part 2 of Figure C above with Figure 5 of page 10 in iCap’s 2021 Annual Report as follows:
The dotted line which is Scottish Mortgage’s NAV shown in Figure 5 in iCap’s 2021 Annual Report is so much different from the one plotted by me in part 2 of Figure C above!
You can argue that the graph shown in Figure 5 is NAV and not price, but even with the slight difference between the price and NAV of Scottish Mortgage, the trend of the graph line will not differ too much. Definitely not like what is shown in Figure 5.
iCap really must announce to us share owners how the graph in Figure 5 is plotted, and from where the data are obtained and what are the actual data obtained.
Discrepency 2
When we compare the trend of the share price/NAV of Scottish Mortgage as shown in Figure 4 of page 9 in iCap’s 2021 Annual Report, the relevant portion being shown below in Figure B. The circled graph shows an uptrend which rise more in the nearest period 2019 to 2021.
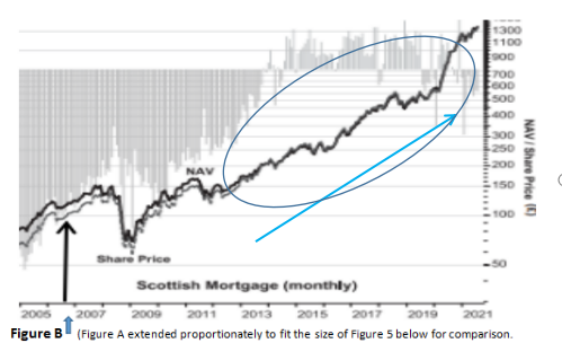
Compared to the dotted line graph in Figure 5 of page 10 in iCap’s 2021 Annual Report as shown below, the circled part is a jagged shape.
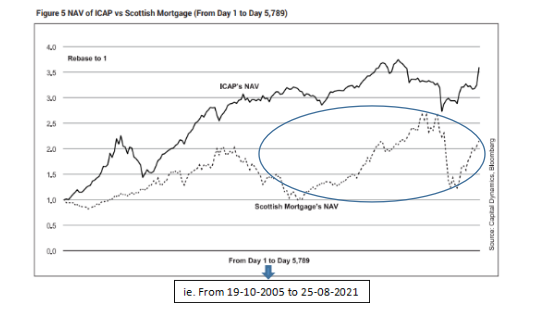
The two graph trend apparently do not match.
While aspiring to match or surpass a top investment trust like Scottish Mortgage has not much to criticize, transparency must first be seen to have been taken care of! The same goes to the NAV growth report year in and year out.
More articles on 4Dview
iCapital.biz - Comparing performance of Closed-end fund to Open-ended unit trusts
Created by cnman53 | Dec 10, 2020
Discussions
1 person likes this. Showing 9 of 9 comments
cnman53 should raise his/her questions in AGM. You always appear here before ICAP's AGM is held, even last year.
2021-11-13 10:49
I have raised my questions by email to iCap on 13 Nov 2020 before the 16th AGM which was held on 28 Nov 2020. But my questions were mainly swept under the carpet and sidestepped in the AGM.
So this is the only way I hope to share my findings with fellow shareholders.
You can refer to my blog on 13 Nov 2020 titled: “Questions to be asked in the 16th AGM” which were the basic questions that I had written to the Chairman of the Board.
I had also emailed further questions to the Chairman on 23 Nov 2020. The questions you can find in my blog of 23 Nov 2020 titled “Further questions to be asked in the 16th AGM”.
I have also talked about the limitations for questions to be raised in the AGM in my blog titled “From Company AGM to Parliament Sitting” on 7 Dec 2020.
We need alternative channel to voice our concern.
2021-11-14 00:48
hello cnman, i dunno what ttb had done to you, making you so aggressively attacking him every time before the AGM and try to find mistakes from the annual report. i saw this post after reading ur post on annual and annualised return (which i have commented also in case you miss it), sincerely hope that you could improve ur reading and knowledge so that you don't look so stpd and sfsh when saying the wrong thing.
after reading ur "hardwork" here, again, i just find it funny and nonsense. i'm shock that there're ppl agreed with you, haha. if you couldn't read the article or report properly, get someone else to help.
it is clearly mentioned that the figure 5 in icap 2021 annual report is comparing the performance of icap vs scottish mortgage from day 1 to day 5,789, meaning for icap, their day 1 is 19 oct 2005 and for scottish, the day 1 is referring to 28 feb 1994 (i guess, by referring to the previous figure). else, ttb will put there form 19 oct2005 to xxx date instead of day 1 to day 5789.
by common sense, if you'll to tell the achievement of 2 ppl with difference age (for eg one is 65 and the other one is 45), for sure you will ask what you have when you're 30? instead of what you have right/what are your achievement now. isn't it unfair to compare what they have now.
please fair, take away ur color specs, and be fair to icap.
2021-11-19 09:15
I sold my Icap @$2.17 in 2020 and swapped the same amount with Genting @$3.30
Forget about this useless and self interest so called "fun manager"
better DIY yourself
Just goggle his ICAP International Valued Fund & Icap Global fund
both tell you thousands word than unnecessarily argument here
2021-11-19 10:13
Evelyn11, you said the day 1 is referring to 28feb 1994 (you guess, by referring...)
So you are guessing? Well don't guess. Why don't you ask ttb to state clearly what date he is using and what data is he using for each date when he plot the graph. That was what I have been asking in my comment. Asking iCap to be transparent in what they do. Especially when ttb tell us that the annual report is the place where investor should pay attention to for iCap, and not the financials. This he has emphasised all along. So definitely I will want to drill into the report and let known what appears to be amiss.
2021-11-19 10:16
TTB actually is inferring his clients to gv icap FUN 50 more years, 70 more years or 100 more years like the Scotish fund thingy, for icap to perform well, and pls don't terminate the FUN at the end of this fun u think around next year or so, please sambung the fun to ur cucu cicit to hv FUN. And for him to realize his ambition for dirikan a successful closed end FUN, 50 years from now.
2021-11-19 10:59
So u all pembeli FUN should according to him pls support to help him 完成想梦想。
2021-11-19 11:01
ya, he draws a cake on the wall, do nothing and enjoys his "easy, perpetual cash free flow" management fees from Icap every year while Icap shareholders and hardcore supporters have endless n unnecessarily debates/argument with one another
2021-11-19 11:19
Post a Comment
Featured Posts
Introducing MY's First IPO Fund for Sophisticated Investors!
New Update. Discover investment communities that resonate with your ideas
M & A Value Partners IPO Equity Fund has been launched - Targeted 13% Return p.a
Latest Videos


Apps


Top Articles
1
Dragon Leong blog
2
Stock Market Enthusiast
Feng Shui Market Outlook for FBM KLCI in the Year of the Wood Snake (2025)
3
The Alpha Trader
5
Stock Market Enthusiast
3 Resilient Stocks That Defied Malaysia’s Market Slump in January 2025 - #GCB, #ABMB, #CDB
7
MQ Market Updates
8
My Trading Adventure 2025
#
Stock
Score
Daily Stocks
Stock Name
Last
Change
Volume
Stock Name
Last
Change
Volume
Stock Name
Last
Change
Volume
MQ Trading Signals
Stock
Time
Signal
Duration
No trading signals available.
Stock
Time
Signal
Duration
No trading signals available.
Featured Advertisers / Partners


Ride The Bull Short The Bear
CS Tan
4.9 / 5.0
This book is the result of the author's many years of experience and observation throughout his 26 years in the stockbroking industry. It was written for general public to learn to invest based on facts and not on fantasies or hearsay....
dumbMoney
Bravo! You really torn apart the fake statistics of TTB. Not many people would want to spend this amount of time to debunk his claims. The mere fact that he has refused to acknowledge the dividend returns of the index when making his comparisons already showed how transparent he is.
2021-11-03 20:45