


AmInvest Research Reports
Stocks on Radar - IJM Corporation (3336)

AmInvest
Publish date: Wed, 20 Feb 2019, 09:17 AM
AmInvest
0 9,057
An official blog in I3investor to publish research reports provided by AmInvest research team.
All materials published here are prepared by AmInvest. For latest offers on AmInvest trading products and news, please refer to: https://www.aminvest.com/eng/Pages/home.aspx
Tel: +603 2036 1800 / +603 2032 2888
Fax: +603 2031 5210
Email: enquiries@aminvest.com
Office Hours
Monday to Thursday: 8:45am – 5:45pm
Friday: 8:45am – 5:00pm
(GMT +08:00 Malaysia)
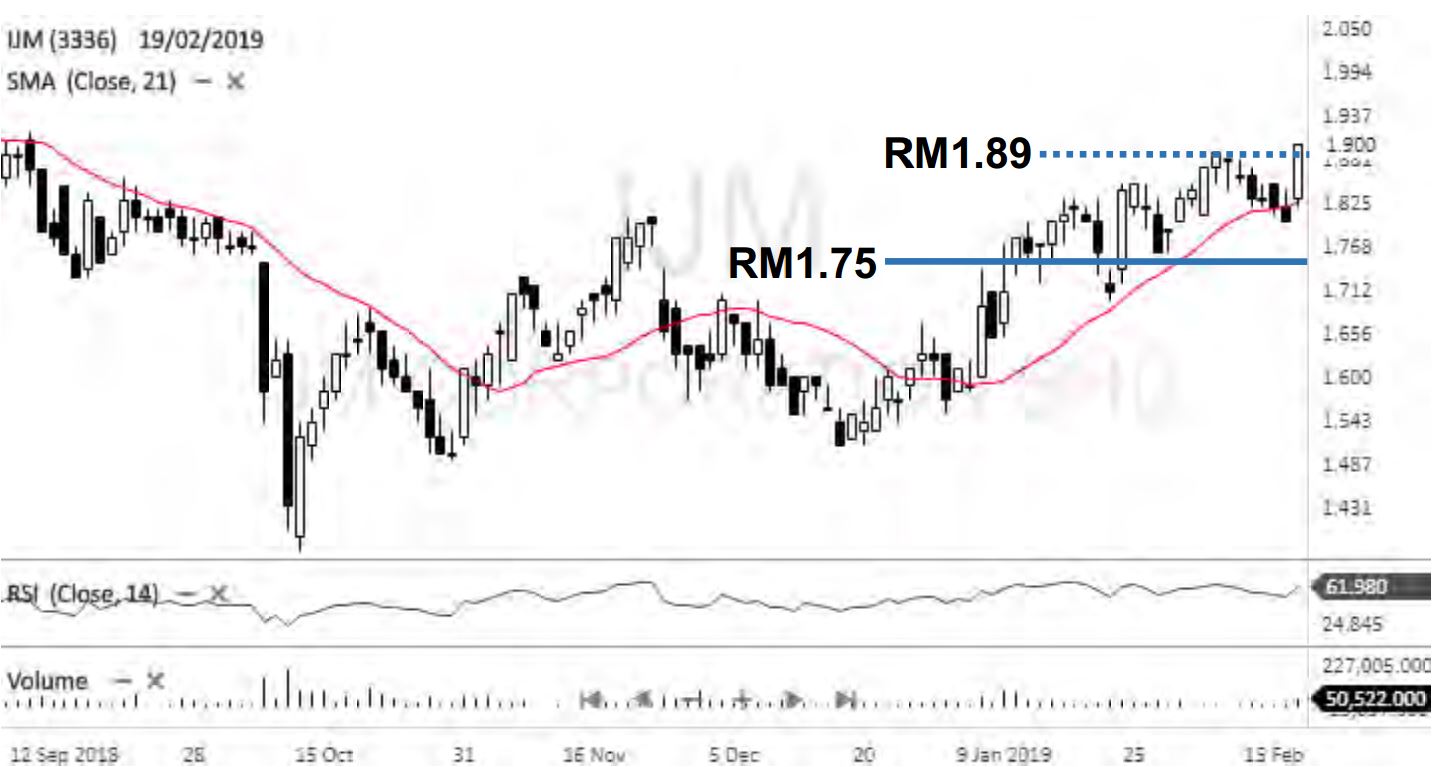
IJM Corporation inched above the RM1.89 level. With a moderate RSI level, a bullish bias may be present above this mark with a target price of RM2.00, followed by RM2.13. Meanwhile, it may continue moving sideways if it dips back below the RM1.89 mark in the near term. In this case, the immediate support is anticipated at RM1.75, whereby traders may exit on a breach to avoid the risk of a further correction.
Trading Call: Buy on further rebound above RM1.89
Target: RM2.00, RM2.13 (time frame: 3-6 weeks)
Exit: RM1.75
Source: AmInvest Research - 20 Feb 2019
Related Stocks
| Chart | Stock Name | Last | Change | Volume |
|---|
Market Buzz
2024-07-30
IJM2024-07-30
IJM2024-07-30
IJM2024-07-30
IJM2024-07-30
IJM2024-07-30
IJM2024-07-30
IJM2024-07-29
IJM2024-07-29
IJM2024-07-29
IJM2024-07-29
IJM2024-07-29
IJM2024-07-26
IJM2024-07-26
IJM2024-07-26
IJM2024-07-26
IJM2024-07-26
IJM2024-07-26
IJM2024-07-26
IJM2024-07-25
IJM2024-07-25
IJM2024-07-24
IJM2024-07-24
IJM2024-07-24
IJM2024-07-24
IJM2024-07-24
IJM2024-07-24
IJM2024-07-24
IJM2024-07-23
IJM2024-07-23
IJM2024-07-23
IJM2024-07-23
IJM2024-07-23
IJM2024-07-23
IJM2024-07-23
IJM2024-07-23
IJM2024-07-23
IJM2024-07-22
IJM2024-07-22
IJM2024-07-22
IJM2024-07-22
IJM2024-07-22
IJMMore articles on AmInvest Research Reports
Discussions
Be the first to like this. Showing 0 of 0 comments
Post a Comment
Featured Posts


Latest Videos


MQ Trading Signals
Time
Signal
Duration
Type
2024-07-30 16:30:00
EMA 5
30 Mins
SELL
2024-07-30 16:30:00
ADX
30 Mins
SELL
2024-07-30 15:30:00
ADX
10 Mins
SELL
2024-07-30 14:50:00
ADX
5 Mins
SELL
2024-07-30 14:30:00
EMA 5
10 Mins
SELL
Apps


Top Articles
1
https://dividendguy67.blogspot.com
2
Good Articles to Share
3
4
7
Mercury Securities Research
#
Stock
Score
Daily Stocks
Stock Name
Last
Change
Volume
Stock Name
Last
Change
Volume
Stock Name
Last
Change
Volume
Featured Advertisers / Partners


Ride The Bull Short The Bear
CS Tan
4.9 / 5.0
This book is the result of the author's many years of experience and observation throughout his 26 years in the stockbroking industry. It was written for general public to learn to invest based on facts and not on fantasies or hearsay....