


AmInvest Research Reports
Stocks On Radar - S P Setia (8664)

AmInvest
Publish date: Tue, 15 Dec 2020, 08:46 AM
AmInvest
0 9,413
An official blog in I3investor to publish research reports provided by AmInvest research team.
All materials published here are prepared by AmInvest. For latest offers on AmInvest trading products and news, please refer to: https://www.aminvest.com/eng/Pages/home.aspx
Tel: +603 2036 1800 / +603 2032 2888
Fax: +603 2031 5210
Email: enquiries@aminvest.com
Office Hours
Monday to Thursday: 8:45am – 5:45pm
Friday: 8:45am – 5:00pm
(GMT +08:00 Malaysia)
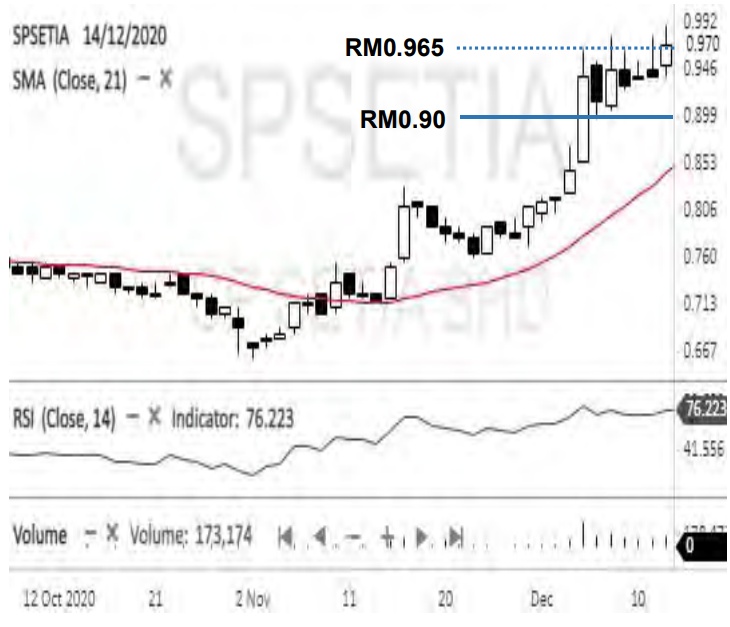
S P Setia surged and tested the RM0.965 resistance level. With its higher high candle stick pattern, coupled with higher trading volume, we see a possibility for a technical breakout. If this happens, we expect it to move towards short-term target prices of RM1.03 and RM1.12. The downside support is projected at RM0.90. Traders are advised to exit on a breach to avoid further losses.
Trading Call: Buy near RM0.965
Target: RM1.03, RM1.12 (time frame: 2-4 weeks)
Exit: RM0.90
Source: AmInvest Research - 15 Dec 2020
Related Stocks
| Chart | Stock Name | Last | Change | Volume |
|---|
Market Buzz
2024-11-28
SPSETIA2024-11-28
SPSETIA2024-11-28
SPSETIA2024-11-28
SPSETIA2024-11-28
SPSETIA2024-11-27
SPSETIA2024-11-27
SPSETIA2024-11-27
SPSETIA2024-11-27
SPSETIA2024-11-27
SPSETIA2024-11-26
SPSETIA2024-11-26
SPSETIA2024-11-26
SPSETIA2024-11-26
SPSETIA2024-11-26
SPSETIA2024-11-26
SPSETIA2024-11-26
SPSETIA2024-11-26
SPSETIA2024-11-25
SPSETIA2024-11-22
SPSETIA2024-11-22
SPSETIA2024-11-21
SPSETIA2024-11-20
SPSETIA2024-11-20
SPSETIA2024-11-20
SPSETIA2024-11-19
SPSETIA2024-11-19
SPSETIA2024-11-18
SPSETIAMore articles on AmInvest Research Reports
Discussions
Be the first to like this. Showing 0 of 0 comments
Post a Comment
Featured Posts
Introducing MY's First IPO Fund for Sophisticated Investors!
New Update. Discover investment communities that resonate with your ideas
M & A Value Partners IPO Equity Fund has been launched - Targeted 13% Return p.a
Latest Videos


MQ Trading Signals
Time
Signal
Duration
Type
2024-11-29 10:00:00
OBV
30 Mins
SELL
Apps


Top Articles
1
Dragon Leong blog
2
save malaysia!
3
Follow Kim's Stockwatch!
4
save malaysia!
5
6
save malaysia!
7
Good Articles to Share
8
PublicInvest Research
#
Stock
Score
Daily Stocks
Stock Name
Last
Change
Volume
Stock Name
Last
Change
Volume
Featured Advertisers / Partners


Ride The Bull Short The Bear
CS Tan
4.9 / 5.0
This book is the result of the author's many years of experience and observation throughout his 26 years in the stockbroking industry. It was written for general public to learn to invest based on facts and not on fantasies or hearsay....