AmInvest Research Reports
Stocks on Radar - GDB Holdings (0198)
AmInvest
Publish date: Fri, 04 Jun 2021, 11:37 AM

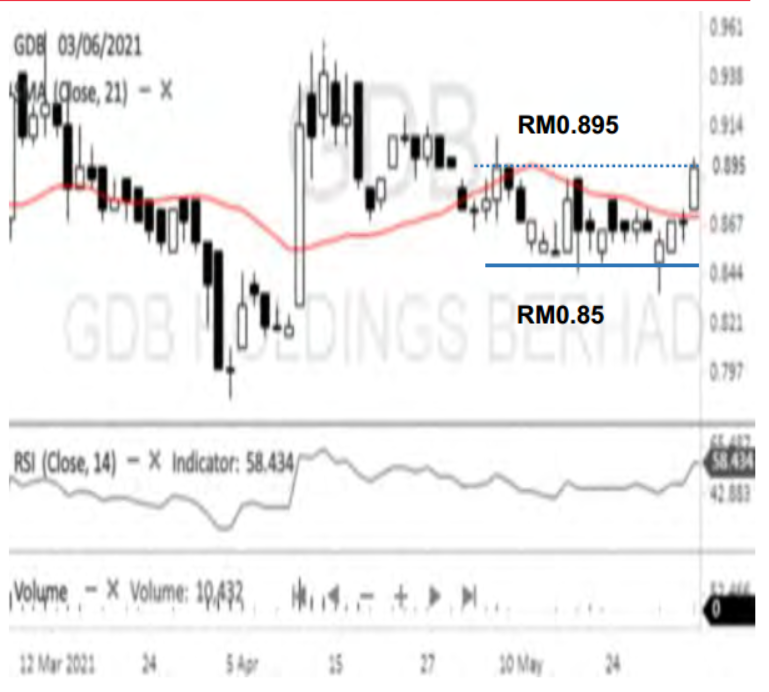
GDB Holdings rose and flirted with the RM0.895 resistance level with a higher trading volume. With its RSI indicator poiting upwards, coupled with a higher high candle stick pattern, there is a good chance that it would experience a technical breakout and head towards a short term target price of RM0.935, followed by RM0.955. A downside support is marked at RM0.85. Traders are advised to exit on a breach to avoid further losses.
Trading Call: Buy on breakout RM0.895
Target: RM0.935, RM0.955 (time frame: 2-4 weeks)
Exit: RM0.85
Source: AmInvest Research - 4 Jun 2021
Related Stocks
| Chart | Stock Name | Last | Change | Volume |
|---|
More articles on AmInvest Research Reports
ALLIANZ MALAYSIA - Slower new business value and CSM growth for life business
Created by AmInvest | Nov 25, 2024
Petronas Chemicals - Closing in to floor on multi-year low foreign holdings
Created by AmInvest | Nov 21, 2024
Discussions
Be the first to like this. Showing 0 of 0 comments


