


https://dividendguy67.blogspot.com
MAYBANK - when to sell?

MAYBANK is my largest holding. I previously blogged about it here. It's my benchmark / reference stock - I compare every potential investment candidate against it. Sometimes, I decide against it, and sometimes I use that money to add to MAYBANK instead on weakness. LOL.
For the past 3 weeks, MAYBANK has been knocking at the resistance around 9.88/9.89. See daily candle chart below. It is close to round number RM10 resistance. The question is - is it time to sell?

In MAYBANK's case, my original investment thesis was it is a solid company (market leader) in a decent industry (banking business) that has more steady earnings and price movement than the KLCI index, and happened to pay generous dividends that matches / beat EPF rates when I entered. My entry price is 8.26, I vaguely recalled the dividend yield was over 6% per annum i.e. between this stock and KLCI index, no question that one would prefer to own MAYBANK.
So, today's price is 9.88. Paper gain 20%. Should I sell?
The problem with using the above chart, is that the time-frame is mismatched. In particular, for long term investors owning MAYBANK, daily candles are too short a period to make such decisions. Why? Because you want to buy near lows and give it many years to get to bull market highs, before you let go. Not let go at each short term gyrations. Plus you collect generous dividend yield (current dividend yield on cost is over 7.0% vs market dividend yield of 5.9%). It typically takes the bull market several years to get to the peak.
There is this rule of thumb for chartists, that if you plan to own a stock for say 5-10 years, your chart horizon ought to be around 3 times longer, meaning ideally you want to look at its price history 15-30 years. For this period, you need to use Monthly Candles, rather than Daily candles.
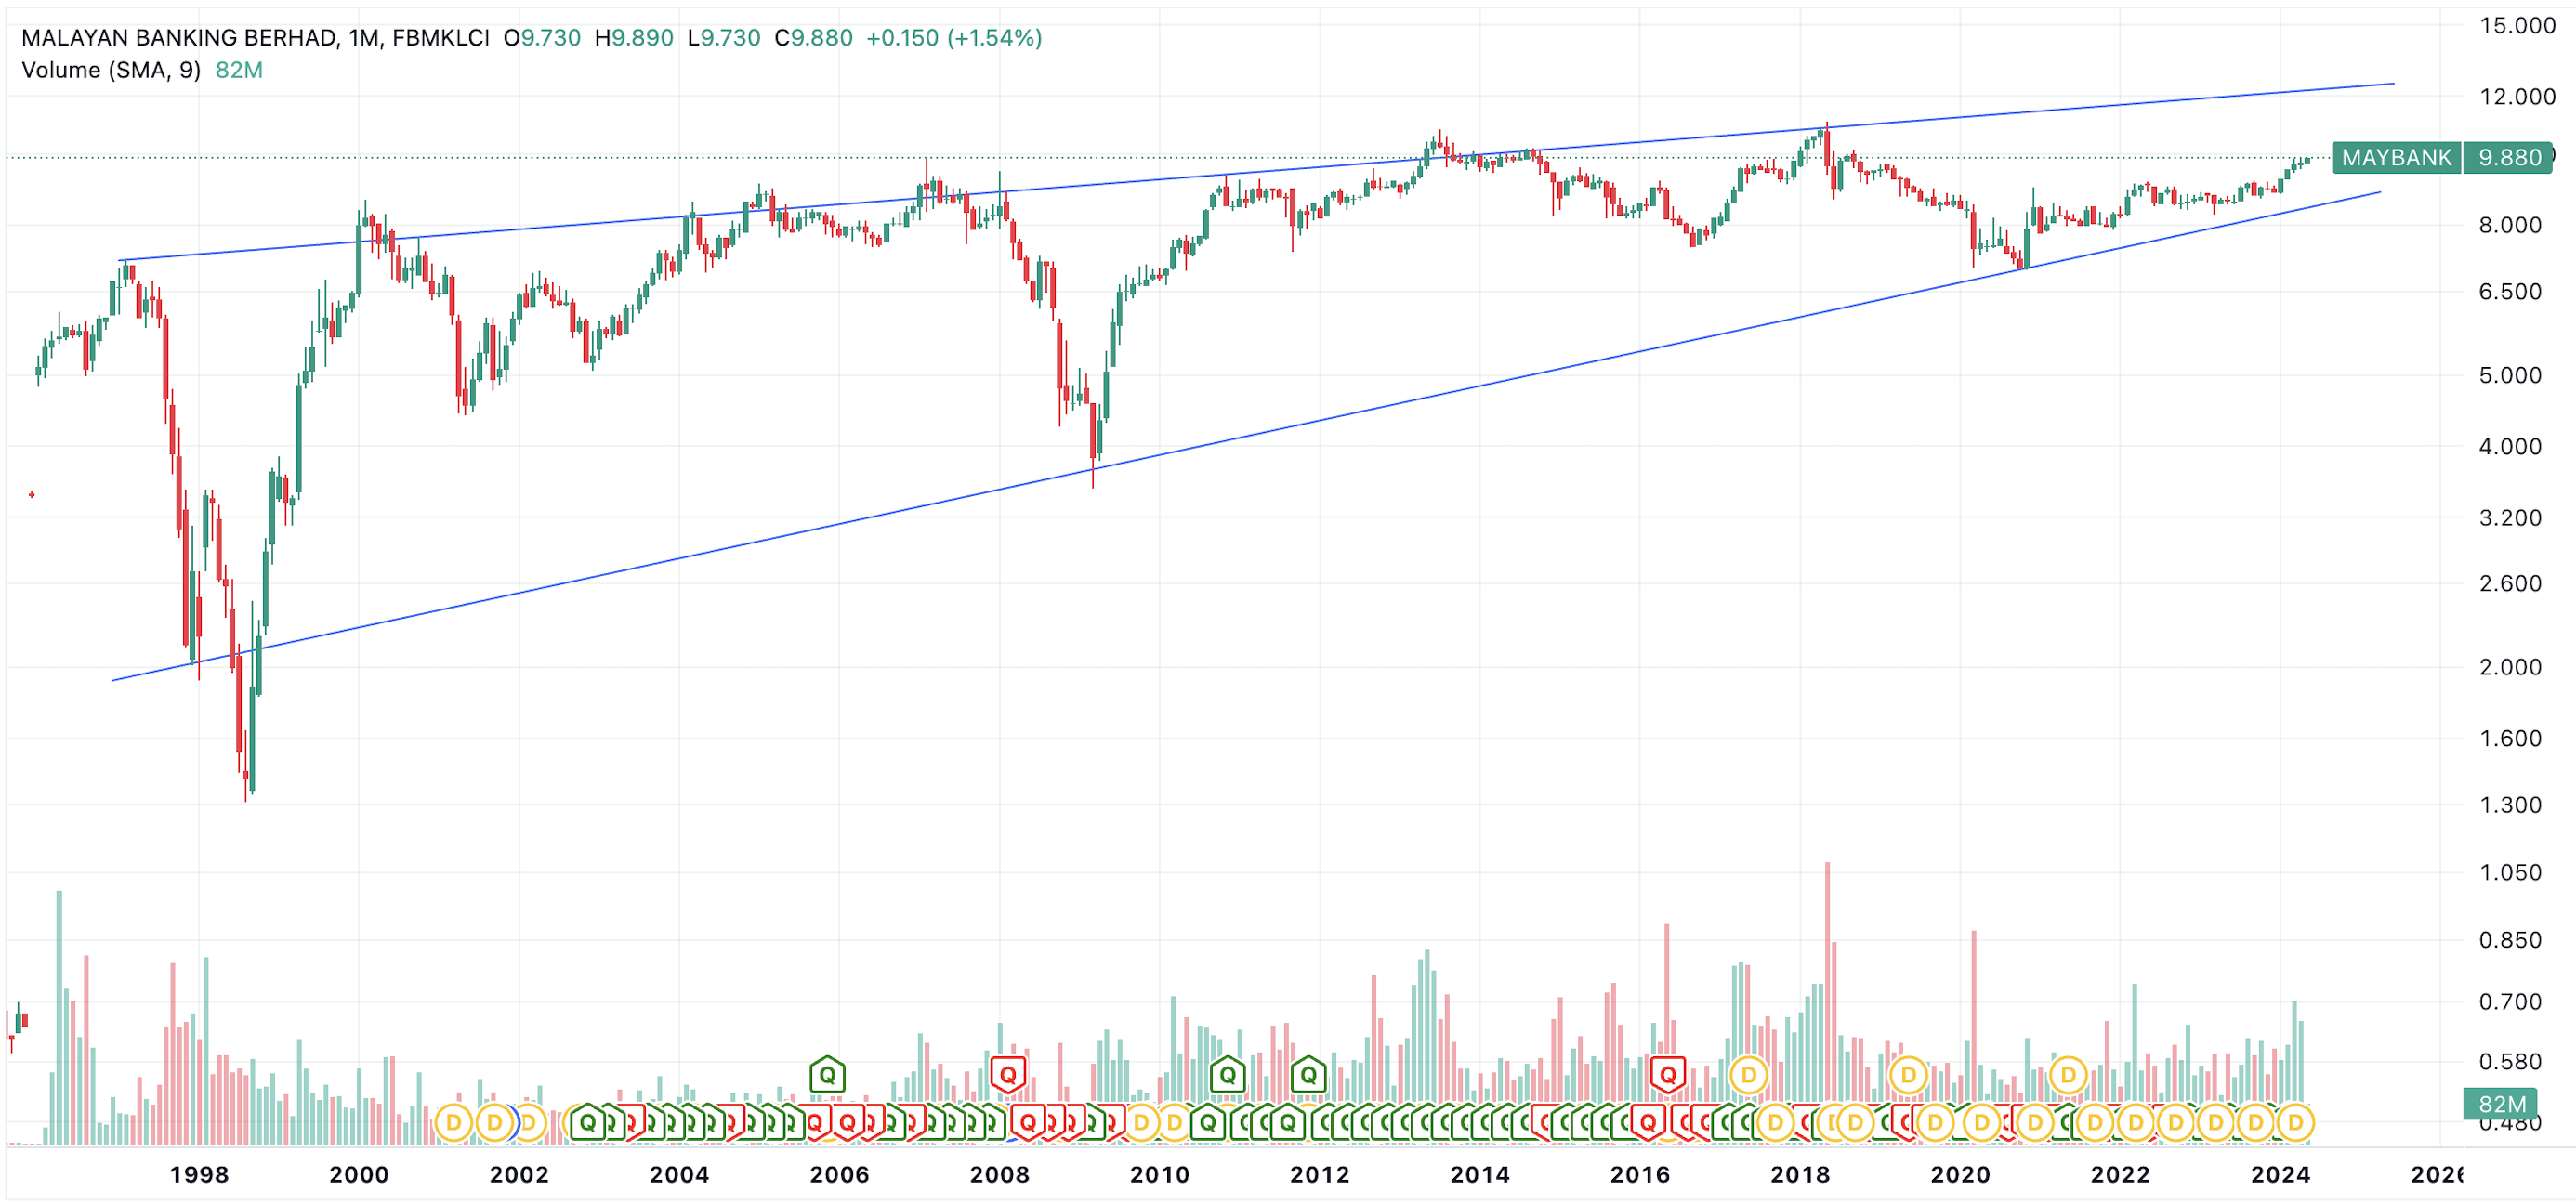
Now, look at the above monthly candle chart over the past 3 decade. What do you see? I would first draw a couple of lines connecting the tops and bottoms over 3 decades that touches the most points. So, what do you see?
Here's what I see.
1. Both lines slope upwards - this is normal and confirms that MAYBANK is an above average stock for the long term. Because the longer you hold, the more likely that price will rise higher over time. Investors love this type of charts.
2. The accumulation zones then become obvious - near that bottom line, you want to buy.
3. The selling zones become obvious - near the top of the top line, you can consider selling, although note point 1 that the longer you hold, the more likely price will rise ie. you don't have to sell everything near the top line. Diversify and sell some in case price goes back down to the bottom line years later and you can then buy back again ... or not.
Back to the original question. Would you sell at RM10?
The answer, once we look at the right chart, is obvious. To me, it's a DEFINITE NO! Why?
RM10 is right in the middle of that channel, in fact, still lower than halfway. RM10 looks "scarily high", but to me, focusing on the 2 lines, it is CLEARLY not yet high.
So, where is the sell price then? To me, a patient investor ought to wait for at least RM12 before considering, near the peak of that top line.
See the difference between looking at the first daily candle chart vs the second monthly candle chart? No question in my mind that long term investors don't really need to look at daily charts but focus on the monthly chart and then act accordingly.
It could take 1-2 or more years to get to RM12. But that's what the generous 6%-7% dividend yield is for. You get paid whilst waiting for the bull run to hit near the peak. And when sell near the top line, all markets will eventually crash, and in theory, if it crashes fast enough to the bottom line, odds are better to buy back at much cheaper price.
However, in MAYBANK's case, it's more tricky than this because MAYBANK pays good dividends. So, the risk of selling is that the longer it takes to crash after you sell, you might find the dividends received during this period overcomes the price difference. So, if in the old days it makes sense, the alternation principle of technical analysis suggests that in the coming future, it might not make sense.
So, stay agile, stay flexible, don't argue with markets. And too early for me to sell MAYBANK at RM10!
Best wishes and cheers!
Disclaimer: These are just my own personal thoughts. You are always responsible for your own investment decision.
Related Stocks
| Chart | Stock Name | Last | Change | Volume |
|---|
More articles on https://dividendguy67.blogspot.com
IBIT Positions as at 24 Jan 2025 - Paper Gains $8,680 in a month!
Created by DividendGuy67 | Jan 25, 2025
How I created US$4,855 "dividend" income in less than 30 minutes
Created by DividendGuy67 | Jan 24, 2025
Happy January! Trump inaugurated, account new all time highs
Created by DividendGuy67 | Jan 22, 2025
Featured Posts


Latest Videos


Apps


Top Articles
1
Dragon Leong blog
2
My Trading Adventure 2025
3
CEO Morning Brief
No Lucky Escape for Bursa AI Proxies From DeepSeek-triggered Selldown
4
THE INVESTMENT APPROACH OF CALVIN TAN
5
CEO Morning Brief
NationGate Hits Three-month Low as Investors Weigh China’s AI Push
6
MQ Market Updates
7
My Trading Adventure 2025
8
HLBank Research Highlights
#
Stock
Score
Daily Stocks
Stock Name
Last
Change
Volume
Stock Name
Last
Change
Volume
Stock Name
Last
Change
Volume
Featured Advertisers / Partners


Ride The Bull Short The Bear
CS Tan
4.9 / 5.0
This book is the result of the author's many years of experience and observation throughout his 26 years in the stockbroking industry. It was written for general public to learn to invest based on facts and not on fantasies or hearsay....
Value Investor Coo1eo
I am glad you decided not to at RM10....to me, this is worth RM30
2024-05-15 11:19