KLSE Stocks Review
FRONTKN (0128) The Story behind the Chart of FRONTKEN CORP BHD
ChartStory72
Publish date: Wed, 16 Jun 2021, 01:16 PM

Frontkn 0128
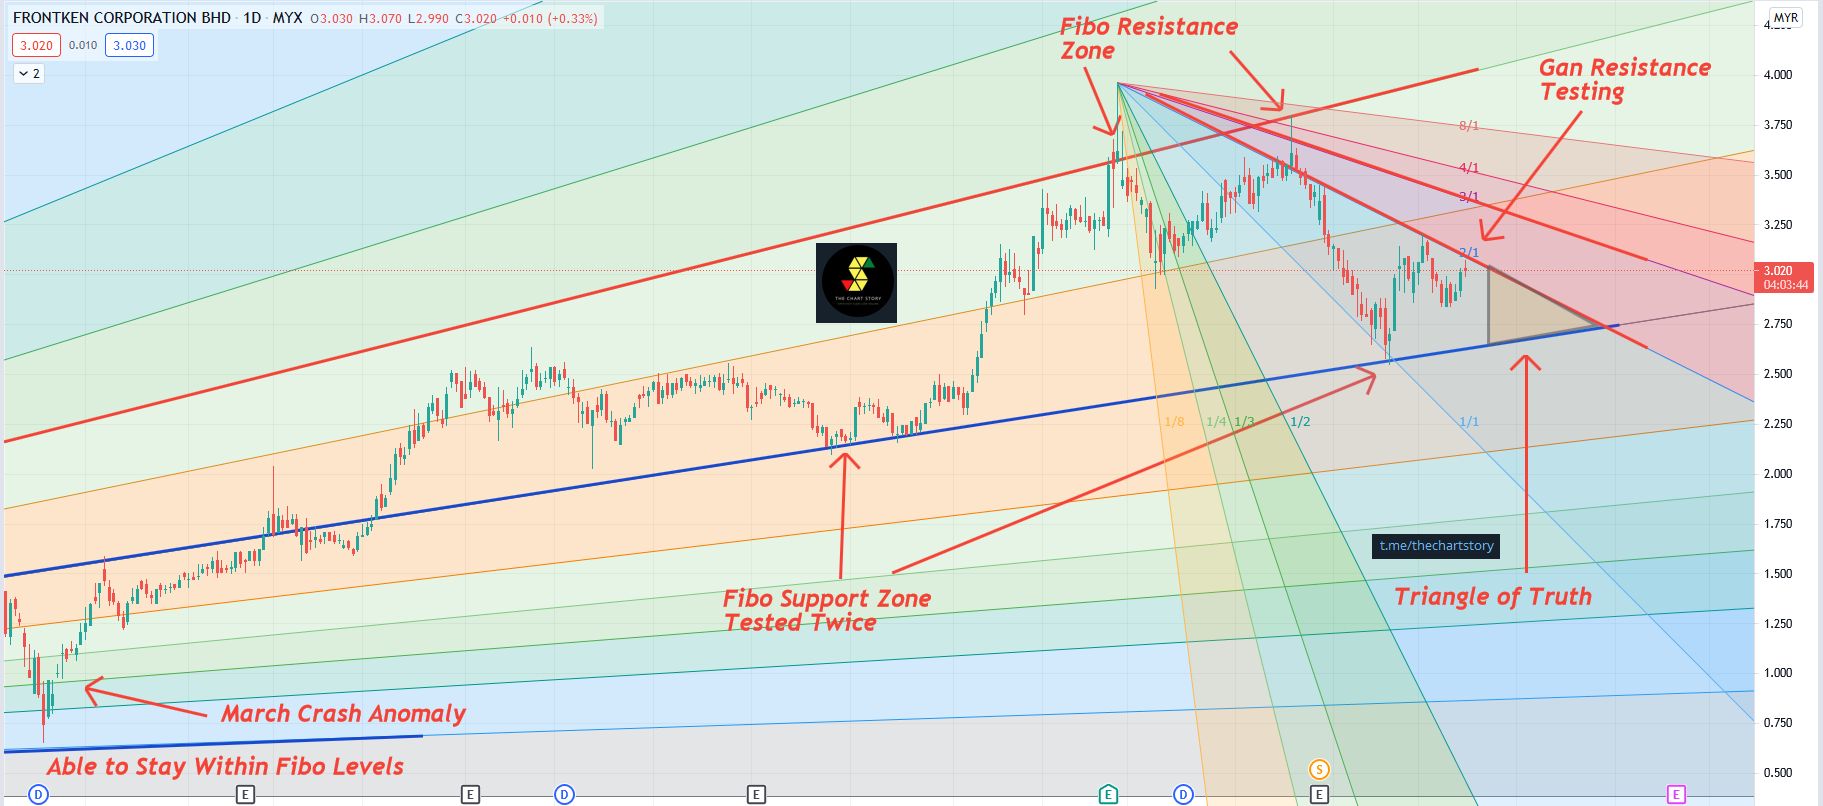
Overall prices are in a strong uptrend. However, if you notice carefully the chart starts to form weakness as the first lower high had formed after the all time high Fibo Resistance 0.382 was tested. Tested Twice somemore, which indicates that prices are indeed unable to breakthrough that fibo level.
Prices rallied all the way down respecting the Gan Area between the 2/1 and the 3/1 Area, tested multiple times and today we see a red doji appearing again exactly at the 2/1 area. Prices are now approaching the Triangle of Truth. The Triangle of Truth is where the bankers will determine whether they should continue pushing the prices up OR just let it go and allow prices to break below the Fibo Support Zone and tank all the way down.
A moment of truth.
Breakdown? Run
Breakup? Happy
Industry: Semiconductors.
In this fast-moving digital world, we get information in a few clicks.
However, we rarely get first-hand information and more often we get misleading news.
Investing in stocks today is very different from the past, but one thing hasn't changed - to study about a stock before putting money in.
A stock chart contains data that is publicly available and accurate by itself. By having certainty in data quality, we can comfortably study charts and make investment judgements.
At Chart Story, we believe stock prices move for a reason. Our objective is to share what we believe.
More articles on KLSE Stocks Review
YTL (0025) The Story behind the Chart of YTL CORPORATION BERHAD
Created by ChartStory72 | May 05, 2022
DSONIC (5216) The Story behind the Chart of DATASONIC GROUP BERHAD
Created by ChartStory72 | Apr 18, 2022
ANNJOO (6556) The Story behind the Chart of ANN JOO RESOURCES BHD
Created by ChartStory72 | Jan 17, 2022
EVERGRN (5101) The Story behind the Chart of EVERGREEN FIBREBOARD BERHAD
Created by ChartStory72 | Jan 11, 2022
TEXCYCL (0089) The Story behind the Chart of TEX CYCLE TECHNOLOGY (M) BERHAD
Created by ChartStory72 | Jan 10, 2022
Wong (7050) The Story behind the Chart of WONG ENGINEERING CORPORATION BERHAD
Created by ChartStory72 | Jan 03, 2022
TOPGLOV ( 7113) The Story behind the Chart of TOP GLOVE CORP BHD
Created by ChartStory72 | Dec 06, 2021
Discussions
Be the first to like this. Showing 0 of 0 comments


