


Artemis FA
MALAYSIA SMELTING CORPORATION, VALUE ARBITRAGE IN PLAY?

First of all, I would like to allocate due credit to paperplane2016 and MoneySifu for bringing up this company to the public attention. Under its Singaporean holding entity, Malaysia Smelting Corporation is an integrated tin-based corporation that recently underwent some management restructuring. Although the past couple of years have fed the company with an immense amount of pessimism due to all their impairment losses abroad, the resignation of their previous CEO and the downfall of tin price, things may turn brighter again. As this piece of mine may be long, I would like to express gratitute to those who offer their time for it and please feel free to provide constructive feedbacks.
Company Introduction
Malaysia Smelting Corporation's main business activities take place in their plant located in Butterworth with a production capacity of approximately 40000 tonnes a year using reverbatory furnace technology. As refined tin metal may be sold to end-user customers or traded on the international commodity markets, there is a ready market in terms of the latter for refined tin metal so the selling margin is significantly influenced by what is commanded in this market. This is a double edged sword as it means the company's pricing power may not be exceptionally huge but at the same time, they do not compete for customers (more relevant for international commodity markets). On the other hand, they compete on the basis of having access to supplies of tin concentrates from third party suppliers so tin mining business is likely to have more pricing power especially in the face of depleting ore reserves globally. Fortunately, the company also operates their own mining business through Rahman Hydraulic Tin and the lease for the mining site expires in 2019 and it is likely that they will be able to extend the license until the depletion of the tin ore resources (Malaysia la). Besides that, the company has a 40% ownership in Redring Solder with the principal activities of manufacturing and sale of solder products for jointing and semiconductor applications in the electrical and electronic industries.
Since Malaysia Smelting Corporation https://klse.i3investor.com/servlets/stk/5916.jsp is involved in both the downstream value-added smelting process and upstream tin mining process, the following highlights the core competencies and weaknesses of both their business as a whole.
Core Competency:
- Integrated producer of refined tin metal: since Malaysia Smelting Corporation is involved on almost all levels of the supply chain, they have better supply chain management and better understanding on product demand and supply
- Credible management team: CEO Patrick Yong [He founded Sulfarid Technology in 2004 which is believed to be involved in developing and marketing electronic and electrical equipment. The company was subsequently acquired by Hup Soon Global Corp in 2007, approximately three years since establishment. He was also the chief operating officer of Tai Kwang Yokohama which is an active player in the battery market. Although not explicitly quoted to him, I believe the company's perspective on the future of battery for EV industry is an idea of his. Similarly, the CFO has 25 years experience with MSC while COO Raveentiran has been in this industry for 25 years.]
- Impressive customer portfolio: Toyota Tsuho Corporation (20 years++), Hanwha Corporation and LG International (Korean conglomerates although recent contribution to sales are not that significant as before), Chemetall GmbH, JPMorgan Metals and a variety of other customers. The company's customer base primarily consists of electronic manufacturers, commodities brokers, London Metal Exchange and Kuala Lumpur Tin Market.
Core Weaknesses:
- Susceptibility to volatility in tin prices: Malaysia Smelting Corporation's financial performance is very affected by the sales price of tin products that affects the size of their margin significantly. Similarly, a rapidly declining tin price may incur more impairment expenses (inventory value, reserve value, etc.) which affects Bursa participants although these are not cash expenses. [tin price has been recovering]
- Exposed to exchange rate: Almost all of the company's income is in USD while cost is in MYR. From time to time, Malaysia Smelting Corporation enters into hedging contracts. [Despite the news indicating recovering ringgit for almost three weeks, the size of the recovery is quite small]
- Reliance on external supplier for tin concentrates: Malaysia Smelting Corporation is reliant on Rwanda and Republic of Congo for tin concentrates supply so disruptions in the form of government policy will affect the company significantly. [The company's RHT mining output is increasing although still supplying only a small portion of their total smelting capacity. Moreover, there will be other suppliers that the company did not disclose]
Risks of mining operation:
- Adverse weather condition such as prolonged periods of rainfall
- Accident or pollution that may cause retaliatory policies by government [unlikely in Malaysia la...]
- Sudden spike in mine reclamation and rehabiliatation liability [Richard Tibault (COO for Mining Operations) was an independent mining consultant and his clients include Government Departments, private mining companies, Government controlled companies and etc. Somemore "guai lou" weih (Canadian), same like Heng Yuan.]
Capacity and Output
| Years | Concentrates (tonnes) | Midstream (tonnes) |
| 2016 | 2228 | 26802 |
| 2015 | 2196 | 30209 |
| 2014 | 2238 | 34971 |
| 2013 | 2223 | 32668 |
| 2012 | 2179 | 37792 |
| 2011 | 2010 | 40267 |
| 2010 | 1769 | 38737 |
Industry Overview
Based on information from ITRI, tin products are commonly used in the following applications:
- Solder-electronic and solder-industrial 54%: Think Semiconductors, Think Now. According to the company, vehicles packed with sensors and new entertainment systems also all need solder joints.
- Tinplate 17%: Packaging
- Chemicals 13%: Plastics can often only be produced with the help of tin catalysts and stabilizers so this became the largest use of tin chemicals. Tin chemical is also particularly used in high-end products such as startstop batteries for mild hybrid cars and advanced lead acid batteries that boost performance using carbon. According to the company, tin has immense opportunity in the battery market as an increasing number of research validify the use of tin as an additive to electrode that can significantly improve battery performance
- Others 16%: Brass, bronze, float glass and others.
As Malaysia Smelting Corporation's performance is highly correlated to the performance of tin, a study of tin prospects are presented below.

With depleting reserves in many major countries while no major discovery of news mine ongoing, it is rather surprising that tin price performance up until now even if one looks from the point of 2009 is less than the growth of of semiconductor sales although this is a scarce resources.

Declining London Metal Exchange inventory over a decade. Basically, LME inventory data is based on LME-approved warehouses (about 700 approved warehouses across the USA, Europe and Asia)that stores tin on behalf of warrant holders.
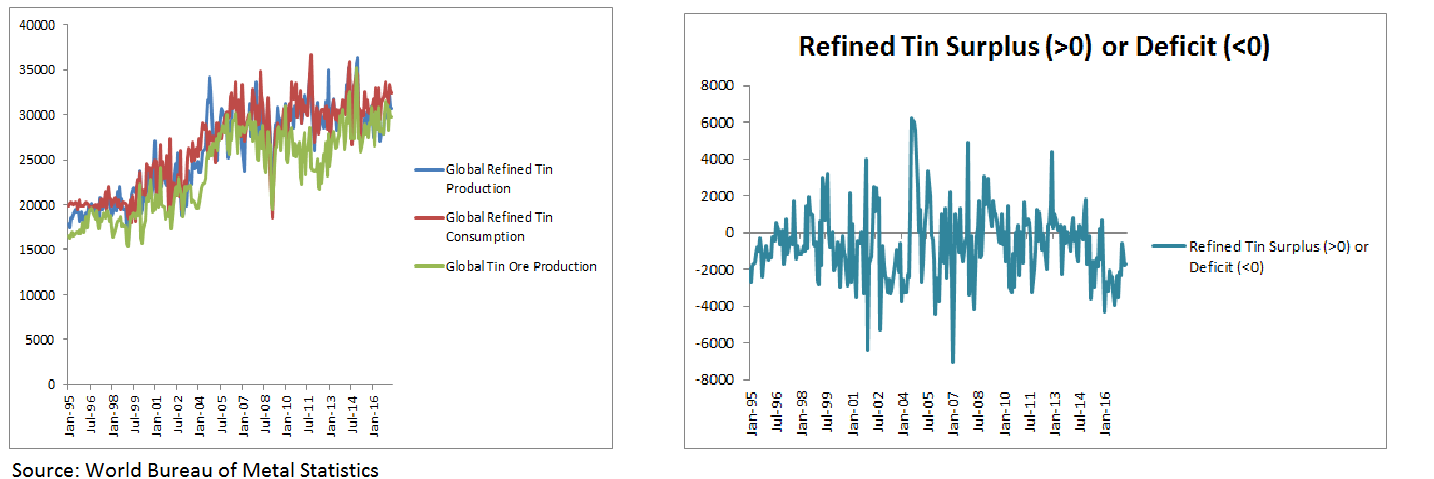
As shown above, tin ore and refined tin production's increment reduced since 2005 while the graph on the right presents the surplus or deficit of refined tin globally. Sure enough, a deficit incurred most of the time from 1995 to 2017 (still in deficit now) and this deficit is expected to be worse due to declining supply (declining grade of tin ores, depletion of reserves) and increasing consumption (semiconductor, batteries and etc.).
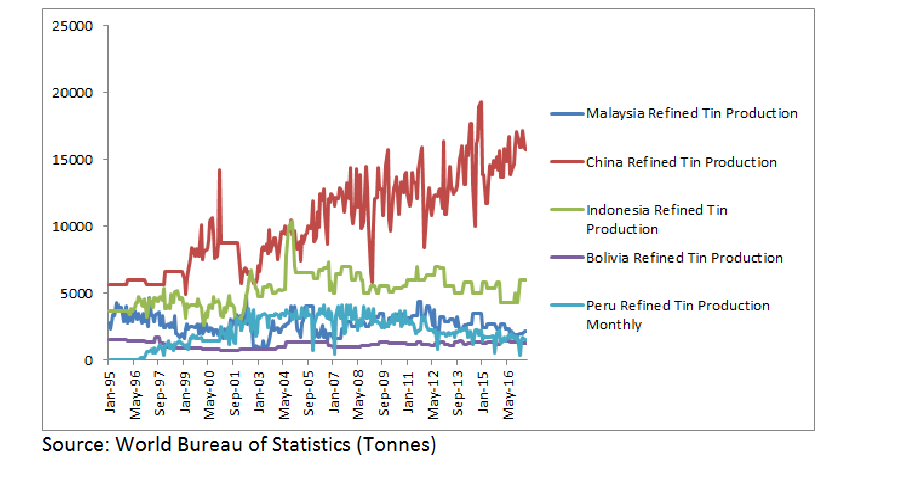
Although China's production of refined tin has been increasing recently, the increase has been significantly fueled by their increase in tin concentrate purchase from Myanmar's tin mining operations. However, this advantage is likely to be phased out (Google has plenty of articles on Myanmar's tin ore depletion and grade decline) soon. Since Malaysia is a small player in the global tin market in terms of tin ore production and refined tin production, it is normal that this sector receives less attention and may have caused some pricing inefficiencies. 
Aside from China, most major producers of tin ores are exhibiting a downtrend in production volume although I have no idea if this is a sustainable decline. One thing for sure is that the grade of tin mines is declining generally which makes extraction rate lower. By the way, Rahman Hydraulic Tin Mining is market leader in production of tin ore in Malaysia because they produced 2228 tonnes while Malaysia as a whole produced 4123 tonnes.
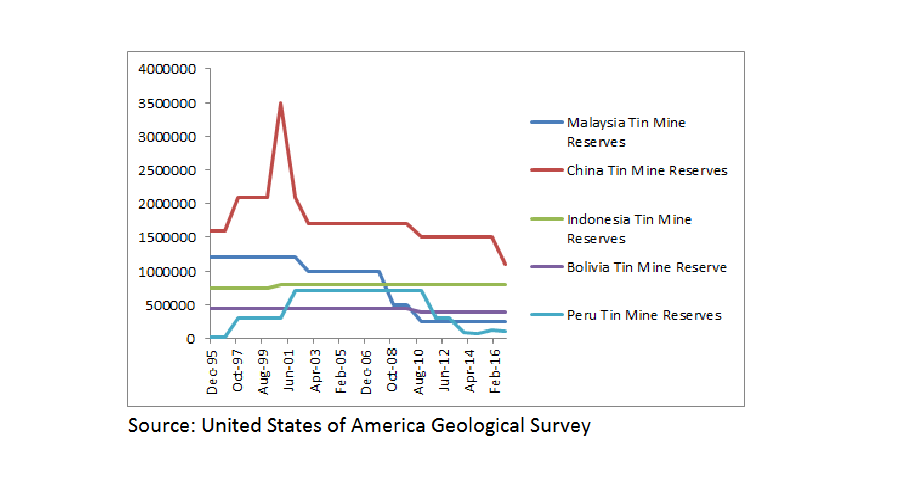
As mentioned, tin mine reserves are generally declining and only Indonesia demonstrated a slight increase in tin mine reserves. Until significant players start discovering new mines, the prospective supply should remain tight and support prices well.
With these circumstances present, I personally have an optimistic idea about the tin market barring a global recession. However, please feel free to come up with your own perspective based on the data provided above.
Historical Performance
Whenever a free cash flow projection is required, I tend to refer to history not because I believe history will repeat itself but it gives me a clue on the general operational performance of the company. Subsequently, a simple comparison with competitors is done to ensure the credibility of the understanding and finally, a projection is carried out based on available catalyst, reversion from historical pattern and due prudence from conservatism. Below is Malaysia Smelting Corporation's historical performance and I chose to use Adjusted EBIT that stripped out one-off transactions, dirty surpluses and etc. to arrive at core operational performance.
| Year | 2010 | 2011 | 2012 | 2013 | 2014 | 2015 | 2016 |
| Revenue | 2738834 | 3098551 | 2328688 | 1591980 | 1915179 | 1464855 | 1477941 |
| YoY % | 13.13% | -24.85% | -31.64% | 20.30% | -23.51% | 0.89% |
| Gross Profit margin (%) | 8.22% | 9.21% | 3.46% | 10.91% | 7.65% | 9.31% | 11.08% |
| Adjusted EBIT margin (%) | 2.56% | 4.21% | -2.44% | 6.82% | 3.80% | 4.93% | 6.15% |
| Tin price in RM | 65418.8 | 79637.91 | 64931.28 | 70633.94 | 71850.62 | 63139.38 | 74543 |
| Property, plant and equipment | 94523 | 92378 | 79210 | 82521 | 88465 | 98893 | 154615 |
| Investment in associates | 148539 | 174181 | 162103 | 107426 | 71318 | 84469 | 37336 |
| NWC as a proportion of revenue | 18.87% | 13.98% | 11.42% | 15.47% | 14.45% | 12.16% | 18.73% |
| CAPEX over Revenue | -2.32% | -1.76% | -0.93% | -0.50% | -0.74% | -0.52% | -3.88% |
| Net debt | 581796 | 327756 | 298096 | 264329 | 222818 | 258175 | 259078 |
As observed above, the revenue of Malaysia Smelting Corporation has been declining which may point to a mean reversion from 2017 onwards. Despite the decline in revenue, adjusted EBIT margin actually increased which contrast the picture painted by the annual reports with all the impairment expenses included. A particularly encouraging thing that I noted is the decline in investment in associates (all their diversification around the whole of Asia back then among different commodities) while the focus in the business core operation through capital expenditure into its property, plant and equipment is back on track. Similarly, the net debt in the company declined despite the huge requirement of working capital within this industry. Sure enough, the difficulty in projection for this company lies in its volatile capital expenditure and net working capital changes.
Free Cash Flow Projection
| Year | 1 | 2 | 3 | 4 | 5 | 6 |
| Revenue | 1670073.33 | 1887183 | 2132517 | 2409744 | 2723010 |
| EBIT margin | 6.50% | 6.50% | 6.50% | 6.50% | 6.50% |
| EBITDA after tax | 99382.6848 | 112797.5 | 127956.3 | 145085.8 | 164442.1 |
| CAPEX | -25051.1 | -28307.7 | -31987.7 | -36146.2 | -40845.2 |
| Increase in NWC | 30450.53 | 33800.09 | 37518.1 | 41645.09 | 46226.05 |
| FCFF | 43881.0549 | 50689.72 | 58450.5 | 67294.54 | 77370.85 | 906448.6 |
| Discount factor | 1.09 | 1.1881 | 1.295029 | 1.411582 | 1.538624 | 1.6771 |
| IV per share net of debt | 5.07423436 |
Assumptions:
-
EBIT margin is assumed to remain at 6.5% although it may turn out to be better based on the following excerpt from 2016 Annual Report.
".... the plant is preparing to introduce modern smelting technology using Top Submerged Lance ("TSL") furnace. This will significantly increase the plant's smelting capacity and drive operating cost down. The refining flowsheet has undergone major changes and is currently capable of processing crude metal with a myriad of impurities."
The latter statement probably meant that the plant is ready to extract efficiently ores of lower grades which is indeed what the market needs considering the decline of global mine grades. As for the former, I am no expert but based on information provided to me by an engineer from the field of chemical engineering, this capital expenditure will increase the efficiency of output by a guess estimate of 20%. More importantly, it is capable of driving down cost significantly because of its high energy efficiency due to greater heat transfer efficiency and mass transfer efficiency (chemicals such as fuel, diesel and other oil-based chemicals are major costs for the company in terms of operational costs and working capital), flexibility in feed intake type, flexibility in fuel utilized and a myriad of other advantages. - Revenue growth of 13% annually for the first five years due to increasing tin price and tin consumption globally. This is a conservative estimate as the fifth year revenue only reaches its revenue level in 2010, right after the global recession. Terminal growth is at 2% which is even lower than the inflation figure just to factor in volatility of capital expenditure for perpetuity.
- Net working capital incurring annual growth of 11% (again to be conservative) although the aforementioned capital expenditure may reduce the size of net working capital required. Similarly, the resulting net working capital projection remains at a range of 17.1% ~ 18.4% of the projected revenue (this proportion is higher than the past 7 year average of 15%). [Refer to Note for more information]
- Capital expenditure to remain at 1.5% of revenue and this total of 7.5% for 5 years is higher than all rolling 5-year sum of capital expenditure as a proportion of revenue in the company's operating history (On the other hand, the company mentioned in their annual report that major capital equipment can last for at least 10 years so I doubt we will see huge CAPEX in the immediate years)
- Depreciation expenses fixed at 10% of property, plant and equipment because it is difficult to calculate accurately as the company uses straight-line method for the value-added part of the business and unit-of-production method for the mining part of the business.
- WACC of 9% given cost of equity at 12.5% (just because I am stingy) and cost of debt at 6.5%.
At the price of RM3.92, the intrinsic value of RM5.07 provides approximately 23% margin-of-safety.
Peer Comparisons
Although Malaysia Smelting Corporation cited Yunnan Tin Group as their major competitor, the business structure of both entity are significantly different in recent years. Additionally, I chosed Indonesia's PT Timah as a peer due to geographical proximity and market similarity although both Yunnan Tin Group and PT Timah's business structure are not entirely representative of Malaysia Smelting Corporation.
Revenue Structure
| Yunnan Tin Group | 2011 | 2012 | 2013 | 2014 | 2015 | 2016 |
| Copper | 0.00% | 18.00% | 39.00% | 57.00% | 62.00% | 58.00% |
| Tin | 83.00% | 68.00% | 53.00% | 32.00% | 28.00% | 27.00% |
PT Tin Group on the other hand is generating approximately 95% of their revenue from tin products (way more emphasis on tin mining than smelting) while MSC is what we already know.
EBIT Margin
| 2011 | 2012 | 2013 | 2014 | 2015 | 2016 |
| YTG | 9.40% | 3.88% | -4.50% | 4.10% | -1.99% | 3.78% |
| MSC | 4.21% | -2.44% | 6.82% | 3.80% | 4.93% | 6.15% |
| PTTimah | 15.06% | 8.73% | 14.17% | 12.81% | 1.19% | 7.14% |
As PT Timah is heavily involved in tin mining, their margin is higher as mentioned initially that the mining segment has more pricing power. Based on the latest 2016 annual report revenue figures in Ringgit translated term, Yunnan Tin Group's annual revenue is around RM21 billion with a market capital of RM13 billion while PT Timah has annual revenue of RM2.5 billion with a market capital of RM1.8 billion. This compares to Malaysia Smelting Corporation's revenue of RM1.5 billion with a market capital of RM400 million. In terms of growth potential, Malaysia Smelting Corporation is more likely to have it than the other two due to a lower revenue base.
Multiples (Earnings based on EBIT)
| Multiples | MSC | YTG | PTTimah |
| EBIT / EV | 13.95% | 3.67% | 11.25% |
| EV / EBIT | 7.2 | 27.2 | 8.9 |
| CFFO / Market cap | 20.74% | 5.65% | 17.52% |
| Market Cap / CFFO | 4.82 | 17.70 | 5.71 |
Since the revenue contribution from tin products for Yunnan Tin Group fell recently, I decided to focus comparing MSC to PTTimah. PTTimah is a largely state-owned enterprise from Indonesia and they are more focused on upstream activities in contrast to MSC's focus on midstream and downstream activity. Despite higher interest rate in Indonesia than Malaysia, PTTimah is getting a more generous valuation on its multiples despite MSC having a stronger growth prospect currently due to all the effort in place. Assuming MSC gets the same EV / EBIT multiple PTTimah is getting, that represents a price of RM5.50. CFFO is used instead of FCFF to determine cash yield because of the volatility in capital expenditure for this industry as a whole. If we compare using the cash yield, MSC at PTTimah's valuation must be at least RM4.70.
Investment Highlights
-
Increasing global semiconductor sales: Kept increasing from the start of this year too. (Just look at SK Hynix and Samsung Electronic stock price)

- Major capital expenditure with management restructuring: With the improvement in operational efficiency as well as better leadership by Patrick Yong (engineering and business background as opposed to Mr. Chua who was heavily from a business background), the company should be able to capitalize on more opportunities especially from the electric and electronic industry.
- Tin scarcity: As llustrated in Industry Overview, tin is still facing structural issues with demand overwhelming supply. Absent a revolutionary breakthrough to replace the use of tin in major applications on a large scale, the relevance of tin will not disappear.
- Undervaluation: Compare to other regional players such as PT Timah (and Yunnan Tin Group if one wants to compare anyway), Malaysia Smelting Corporation is currently undervalued.
Risks
- Significant strengthening of RInggit against US Dollar
- Huge discovery in tin mine reserves globally
- Global recession (almost everyone sells almost everything irrationally)
Shareholding Structure
For more information on this, please refer to the article written by paperplane2016 at https://klse.i3investor.com/blogs/moneymoney/108898.jsp Based on transaction data, both prominent investors are still holding their stake in the company. With a low proportion of floating shares, any immediate catalyst may influence price significantly. These investors definitely have way more access to information than retailers so their position may be telling.
Conclusion
Given the relevance of the core competencies of the company in the current business environment coupled with major catalyst at hand, the business potential is likely to be assymmetrical assuming the major risks highlighted do not materialize in a disruptive way. A value arbitrage with reference to Ringgit Tin Price, Malaysian semiconductor players and other tin players? As the lack of dividend payment became one of the reason for undervaluation, this may change as the company recently started paying dividend again. This is not an investment recommendation but merely my personal opinion with very heavy sense of conservatism.
Please feel free to provide feedbacks for me to improve my writings further.
Note:
Based on data stretching all the way back to 1990, a linear regression model (non-spurious due to randomnity of residuals) showed that a 1% increase in revenue for the company corresponds to an average increase of 0.6% in net working capital. While some may think data that far away may deemed obsolete, shorter time frames of about 17 years provided similar results. Whatever it is, the assumption that NWC grows at 11% when revenue is growing at 13% already incorporates adequate conservatism unless the management is just very incompetent.
More articles on Artemis FA
Has current valuation of BRITE-TECH BERHAD incorporated its rosy future already?
Created by Artemis | Aug 03, 2017
Does Joel Greenblatt's Magic Formula work empirically as preached by Kcchongnz?
Created by Artemis | Aug 01, 2017
Discussions
1 person likes this. Showing 6 of 6 comments
this article for your reference as well - http://www.theedgemarkets.com/article/topbrass-change-part-revamp-%E2%80%94-malaysia-smelting
2017-07-24 23:22
Post a Comment
Featured Posts


Latest Videos


Apps


Top Articles
1
Stock Market Enthusiast
Top 3 AI/Data Center Newsflow for the 3rd Week of December - #TENAGA, #YTL, #YTLPOWER
2
save malaysia!
3
Good Articles to Share
4
Good Articles to Share
5
Good Articles to Share
Gaza ceasefire deal 'closer than ever', says Hamas and two allies
6
Good Articles to Share
Ryan Serhant makes bold pitch to fix the housing ‘affordability crisis’
7
Good Articles to Share
8
#
Stock
Score
Daily Stocks
Stock Name
Last
Change
Volume
Stock Name
Last
Change
Volume
Stock Name
Last
Change
Volume
MQ Trading Signals
Stock
Time
Signal
Duration
No trading signals available.
Stock
Time
Signal
Duration
No trading signals available.
Featured Advertisers / Partners


Ride The Bull Short The Bear
CS Tan
4.9 / 5.0
This book is the result of the author's many years of experience and observation throughout his 26 years in the stockbroking industry. It was written for general public to learn to invest based on facts and not on fantasies or hearsay....
John Lu
Good
2017-07-22 17:38