


Candlestick & Breakout Patterns
JHM Rounding Bottom + Flag Break Up

Ming Jong Tey
Publish date: Thu, 22 Dec 2016, 06:25 PM
Ming Jong Tey
0 68
Understand the psychology behind the candlestick & breakout pattern will give you an edge to realize why the market does what it does and anticipate opportunities before they happen!
Get notified on The Next Best Trading & Investing Ideas for free:
Visit ==> http://www.vipplatform.com/lp/ideas/
"Like" FB Page ==> https://www.facebook.com/BursaSGXcandlestick/
"Join" Telegram Channel ==> https://t.me/BursaSGXCandlestick
Get notified on The Next Best Trading & Investing Ideas for free:
Visit ==> http://www.vipplatform.com/lp/ideas/
"Like" FB Page ==> https://www.facebook.com/BursaSGXcandlestick/
"Join" Telegram Channel ==> https://t.me/BursaSGXCandlestick
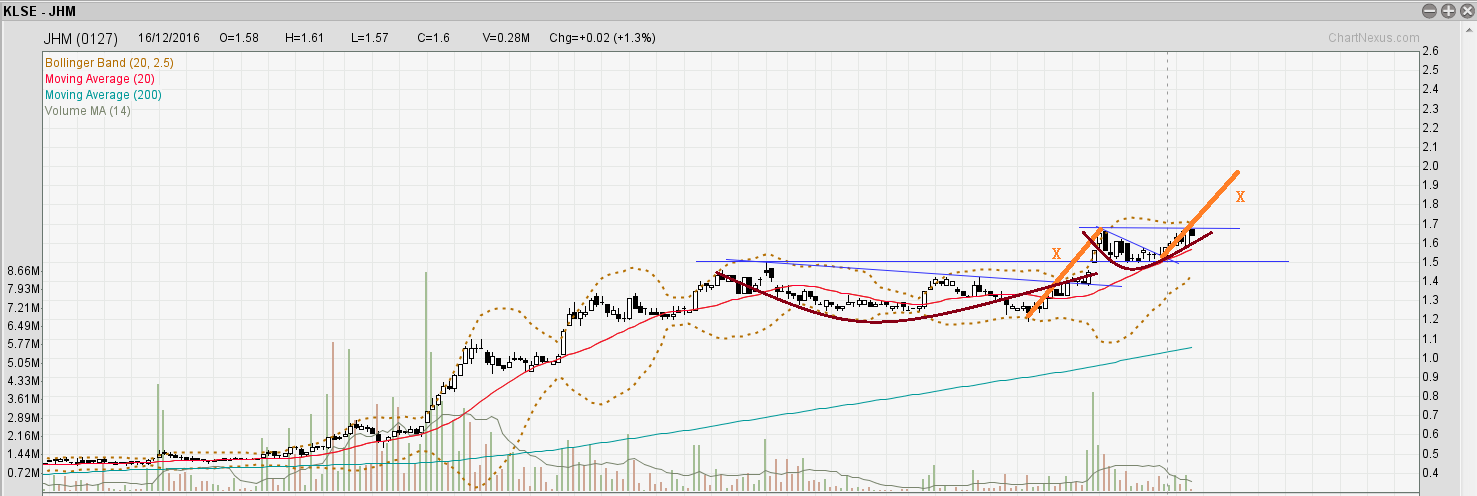
JHM: Bullish
Pattern: Rounding bottom & Bullish Flag Break Up
-
Target Price 1: 1.86
-
Target Price 2: 2.00
-
Target Price 3: 2.30
1.65 has been achieved after breaking up from the first rounding bottom from Aug till Nov 2016. Subsequently, it forms a bullish flag pattern and broke up at 14 Dec, which gives a TP of 2.00 (projection of X as shown in the chart below).
Yesterday, JHM hit the neckline (1.68) of the second rounding bottom. If the price breaks above the neckline, the first TP will be 1.86, follow by 2.0 based on the flag pattern.
If the super bull can continue, it is likely to hit 2.30 based on a bigger timeframe of a bullish flag break up.
Refer to the charts below for analysis:
What's your view on JHM? Feel free to throw in fundamental, news, discounted cash flow or any other forms of analysis :)
Topics That You Do Not Want To Miss
How to determine the "bullishness" of the patterns- https://www.facebook.com/BursaSGXcandlestick/videos/378260995905662/
The Trade Management Technique You Need To Know - http://klse.i3investor.com/blogs/candlestick/114496.jsp
Best Way To Learn To Trade Without A Mentor --> http://klse.i3investor.com/blogs/candlestick/113821.jsp
Entry Illustration --> http://klse.i3investor.com/blogs/candlestick/113605.jsp
Stop Loss & Safe Trading --> http://klse.i3investor.com/blogs/candlestick/113510.jsp
Position Sizing --> http://klse.i3investor.com/blogs/candlestick/113061.jsp
Come Up With Trading Ideas & Turn Them Into Investing Ideas - http://klse.i3investor.com/blogs/candlestick/114110.jsp
Cheers,
Ming Jong
Get Update From ==> http://www.vipplatform.com/lp/ideas/
& FB page ==> https://www.facebook.com/BursaSGXcandlestick/
Telegram Channel ==> https://t.me/BursaSGXCandlestick
Contact Via Email ==> ![]()
More articles on Candlestick & Breakout Patterns
IQGROUP Rounding Bottom Breakout With A Beautiful Uptrending Channel
Created by Ming Jong Tey | Jun 29, 2017
RCECAP Rounding Bottom Breakout Plus Trending Up Inside A Channel
Created by Ming Jong Tey | May 25, 2017
PENTA Revisit - Rounding Bottom Breakout In A Long-Term Time Frame
Created by Ming Jong Tey | May 21, 2017
Discussions
4 people like this. Showing 7 of 7 comments
Hi Andyhard, I am vested in JHM & YongTai-WA. The other 3 still pending. The patterns emerged for stocks the mentioned here definitely for swing / position trading, not for day trade.
You are right. Charting is an art. Different people might spot different patterns and draw different angle for the trendline.
If I were to do the charting on JHM 3 months later, the chart will be similar, unless some trendlines are no longer valid (i.e. break down from the trendline), I might need to draw a few more if appropriate...Not sure if this is what you are referring to?
For me, I separate trading and investment as the money management is totally different...
If I trade based on chart analysis, the most important thing for me is to set stop loss and position size based on the chart. I am not too picky on how to project the target price as there are many ways to do it.
Fibo fanatic might prefer to use multiple Fibo ratio to form the target X. Hence, we could have different target price for the same pattern.
2016-12-27 21:49
Hi Ming Jong,
Thanks for your information. I totally agree with you the management of trading and investment is different. From what you explain to me, I understand this is the technical analysis commonly used in market.
Just to share with you, I used more on volume and spread. However, I did modify in a way that will give me more confidence on holding mid term (3 months to 6 months) especially when investing. Johotin, I bought around 20 sen for the warrants just about 3 months ago. JHm I bought around 55 sen on March this year and sold during end of Aug at 1.38. This are the fundamental stocks that I bought and I use technical for entry/exit that shorten my waiting time. You may see my previous comments.
Just to understand are you purely based on pattern to judge the stock trend ?
2016-12-28 12:31
Hi Andyhard,
Did you mean volume spread analysis (Wyckoff method)? Anyway, I know a lot of people combine fundamental and technical just like yourself.
For stock trend, it goes back to the fundamental 101, higher high and higher low, lol...
I trade mainly on Support / resistance, trendline, pattern, price action and volume. Sometimes, I do use indicators (like RSI) to spot for divergence.
2016-12-28 13:14
Hi Ming Jong,
Yes, the VSA is a triggering method for me to dig deeper into it. I find that VSA also being too short term. In fact, noise is higher in short term. Thus, I did modify it and use for being mid and long term investment. I find that it is quite useful.
A lot of breakout could be fake or a trap. If we do not analyse the chart in an overall view, it will always being trapped and sometimes stop loss is not fast enough as the drop could be very significant like what happened in Gadang and Mycron. Thus, this is the reason I have modified based on VSA.
ANyhow, any method is a good mehod if it works for you to become profit. I am glad you share your knowledge with me..
2016-12-28 15:05
Thanks for sharing, Andyhard.
Yup. There are quite a few nitty gritty to look into when trading breakout to avoid fake out...
Although trading on charts, I will often avoid trading earning announcement to prevent the gap.
What's your favourite book on VSA? Keen to find out more :)
2016-12-28 18:06
I am going to share with you one very simple strategy based on a strong and easily noticeable candlestick pattern. They call it "Lucky Spike". Everyone can learn it, use it and make money with it. There are traders who make a living trading just this pattern. Just check out this ebook I am giving you for free:==> http://www.forexmystery.com?hgd4h84gdh
2018-07-09 12:23
Post a Comment
Featured Posts


Latest Videos


Apps


Top Articles
1
Axcapital's investment blog
KAB - Executing its way to a record quarter. Could more Petronas contracts be coming?
2
Koon Yew Yin's Blog
3
BFM Podcast
4
BFM Podcast
5
7
BFM Podcast
8
BFM Podcast
#
Stock
Score
Daily Stocks
Stock Name
Last
Change
Volume
Stock Name
Last
Change
Volume
Stock Name
Last
Change
Volume
MQ Trading Signals
Stock
Time
Signal
Duration
Stock
Time
Signal
Duration
Featured Advertisers / Partners


Ride The Bull Short The Bear
CS Tan
4.9 / 5.0
This book is the result of the author's many years of experience and observation throughout his 26 years in the stockbroking industry. It was written for general public to learn to invest based on facts and not on fantasies or hearsay....
andyhard
Hi,
A few of the stocks you mentioned was actually in my portfolio for investment and trading (some stocks I just treat as trading as their fundamental wise I am not familiar with).
Just a bit curious, on the way you drew the rounding and target price. Have you ever trade on the stocks you mentioned? I am here to learn from you not other purpose. I am a technical guy as well..and I did use it for my investment. I am more to spot a trend...I don't do daily trade.
I am sorry to say that personally I feel drawing a pattern and trend line is a bit virtual as the same person on same chart can draw the trend line with different angle each time.
2016-12-27 19:24