


Candlestick & Breakout Patterns
CUSCAPI - Cup And Handle Breaking Out With Volume Analysis

Ming Jong Tey
Publish date: Wed, 22 Mar 2017, 05:26 PM
Ming Jong Tey
0 68
Understand the psychology behind the candlestick & breakout pattern will give you an edge to realize why the market does what it does and anticipate opportunities before they happen!
Get notified on The Next Best Trading & Investing Ideas for free:
Visit ==> http://www.vipplatform.com/lp/ideas/
"Like" FB Page ==> https://www.facebook.com/BursaSGXcandlestick/
"Join" Telegram Channel ==> https://t.me/BursaSGXCandlestick
Get notified on The Next Best Trading & Investing Ideas for free:
Visit ==> http://www.vipplatform.com/lp/ideas/
"Like" FB Page ==> https://www.facebook.com/BursaSGXcandlestick/
"Join" Telegram Channel ==> https://t.me/BursaSGXCandlestick
CUSCAPI (0051): Bullish
Pattern: Cup & Handle Breaking Out WIth A Falling Wedge TP Achieved
Let's start with CUSCAPI's weekly chart below:
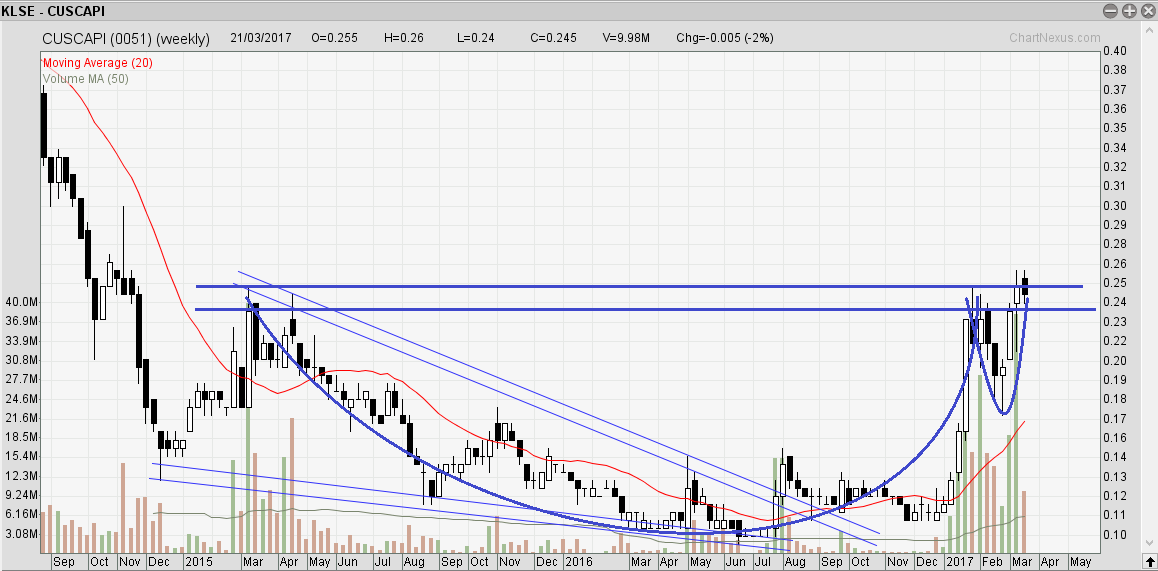
CUSCAPI broke out from the falling wedge reversal pattern in the beginning of August 2016 and subsequently hit the target price of 0.25 based on the pattern projection.
Now, it is attempting to break out the neckline of the cup and handle pattern. Should CUSCAPI successfully penetrate above the neckline, the projected target price is 0.40, which coincides with the major overhead resistance.
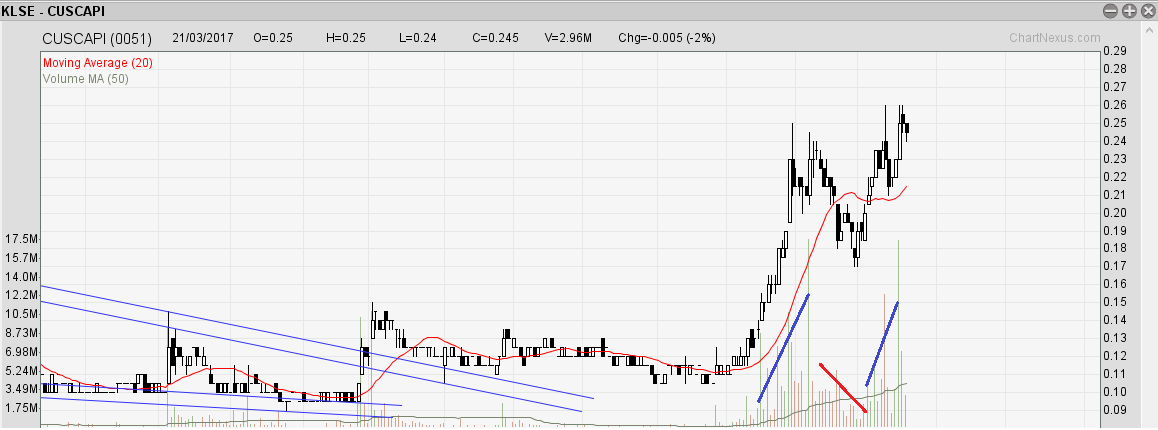
From the daily chart above, we can see the rising is accompanied by increasing volume. During the pull-back period to create the handle, the volume is also decreasing. In its recent push attempting to break the neckline, the volume is rising. This is a healthy sign to show its bull momentum.
Having said that, we will need to see CUSCAPI stay above the neckline, 0.25 to confirm the breakout.
I stay bullish when CUSCAPI is above 0.21. If you are after Cuscapi's future prospects & FA aspects, YiStock has written a great post last week.
Leave me a comment below and let me know what you think. If you have any queries or want to share the next big stock with me, feel free to contact me via my email or FB page below.
Do you enjoy this post? Give me a "Like" below:

Topics That You Do Not Want To Miss
How to determine the "bullishness" of the patterns- https://www.facebook.com/BursaSGXcandlestick/videos/378260995905662/
The Trade Management Technique You Need To Know - http://klse.i3investor.com/blogs/candlestick/114496.jsp
Best Way To Learn To Trade Without A Mentor - http://klse.i3investor.com/blogs/candlestick/113821.jsp
Entry Setup Illustration - http://klse.i3investor.com/blogs/candlestick/113605.jsp
Stop Loss & Safe Trading - http://klse.i3investor.com/blogs/candlestick/113510.jsp
Ultimate Guide For Position Sizing - http://klse.i3investor.com/blogs/candlestick/113061.jsp
Come Up With Trading Ideas & Turn Them Into Investing Ideas - http://klse.i3investor.com/blogs/candlestick/114110.jsp
Cheers,
Ming Jong
Get Update From ==> http://www.vipplatform.com/lp/ideas/
& FB page ==> https://www.facebook.com/BursaSGXcandlestick/
Telegram Channel ==> https://t.me/BursaSGXCandlestick
Contact Via Email ==> ![]()
More articles on Candlestick & Breakout Patterns
IQGROUP Rounding Bottom Breakout With A Beautiful Uptrending Channel
Created by Ming Jong Tey | Jun 29, 2017
RCECAP Rounding Bottom Breakout Plus Trending Up Inside A Channel
Created by Ming Jong Tey | May 25, 2017
PENTA Revisit - Rounding Bottom Breakout In A Long-Term Time Frame
Created by Ming Jong Tey | May 21, 2017
Discussions
1 person likes this. Showing 5 of 5 comments
Great job, CUSCAPI, hit the TP 0.40 :) http://www.theedgemarkets.com/my/article/penny-stock-software-counters-spike-after-alibabas-overseas-e-commerce-malaysian-hub
More legs are coming!
2017-03-23 13:54
Post a Comment
Featured Posts
Introducing MY's First IPO Fund for Sophisticated Investors!
New Update. Discover investment communities that resonate with your ideas
M & A Value Partners IPO Equity Fund has been launched - Targeted 13% Return p.a
Latest Videos


Apps


Top Articles
1
Good Articles to Share
2
3
Mercury Securities Research
4
Koon Yew Yin's Blog
5
BFM Podcast
6
BFM Podcast
7
#
Stock
Score
Daily Stocks
Stock Name
Last
Change
Volume
Stock Name
Last
Change
Volume
Stock Name
Last
Change
Volume
MQ Trading Signals
Stock
Time
Signal
Duration
Stock
Time
Signal
Duration
Featured Advertisers / Partners


Ride The Bull Short The Bear
CS Tan
4.9 / 5.0
This book is the result of the author's many years of experience and observation throughout his 26 years in the stockbroking industry. It was written for general public to learn to invest based on facts and not on fantasies or hearsay....
Shellhouse
omg
2017-03-23 10:13