


Hotstock+daily
Hotstock+daily

Every stock has its day and often associated with notable news/announcements. Will their performances sustain and reflect a true market view (Dow theory).. Lets take a look at these daily hot stocks and observe their performances at T+1, T+2, T+3(last pick-up day) and T+4:
|
T (14/3/2014) |
LTKM |
ASIABIO |
KNM |
MMSV |
MASTER | ..... |
* Market mover = market perception/sentiment(stochastic, major investor activities) + hedge-fund/contra activities(active volatility, futures movements) + news/announcement(uncertainties, market usually heading). Market watch: KLCI stocks, research promoted stocks, rumoured stocks, hot stocks. Stocks may generally be screened using equity screener, and watch/screen using charting tools. As information adds sense to stock watching, low profile low volatility stocks(hidden gems) may be dug by TA+FA screens.(Investors are often battling against the market/market quote in big cap markets, the market is often battling against dominant investors/investors' quote in small cap markets)
- Investment time frame in stock market may be compressed through trading of hot stocks (by tracking the development / progress of first day up candle|without "David Copperfield"/tunnelling vision & predator's tech.:) probable wave following last wave up volume > down volume, for examples). Stocks with holding fundamental may also emerge as hot stocks on their upward runs.
- Investor/enthusiast on the KLCI and allocation of its component stocks may visit this site (updating weekly) for some quantitative info. KLCI movement/projection may refer to DJI/DJI futures for indication as they are closely correlated, and that hot stocks generally perform better in up-market. (e.g. a bet on tomorrow KLCI gap up/down may be seen before market close following DJI futures' tip)
- Hot stocks mostly high in energy(liquid+swing) and usually volatile, and retracements are often seen when force selling activities prevail(e.g on the T+4s, legitimate intraday "short selling"/mark down-roll over :)). If market has only one day memory, hot stocks at market close may be featured as "daily IPOs" for coming day.
* Chart analysis : A charting tool that I come across poviding handy indication of investor activities is the Homily softwares. Their proprietary MCD indicator shows the relative investor participation strength/rally between buying(red) and selling(green) pressures(traded). (As observed from the indicator, high traded buying pressure often associated with relatively high volume and low volume when traded selling pressure is high. This gives and indication of investor relative strength, as dominant investors enter the market, stock prices usually surge up accompanied by high trading volume, and vice-versa. As the software describes, the indicator is a price-volume-space combination analysis)
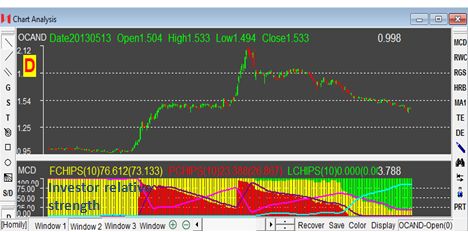
- any interest / queries regarding the software may contact me (ct chan at cvecct@yahoo.com.my , 017-3376518) for further details / review. (NB: past records show that a red prevailling KLCI MCD indicating a prevailling bull market :))
* Stock trading vs dice rolling: Take a stock as dice and the entry price as 3.5, numbers above 3.5 as up and below 3.5 as down. Roll the dice, chance that the stock will go up or get down is equal and volatile.
- Trade two stocks as roll two dices and take the sum. Perform this simulation(click here) and see how the investment may vary.. (best wishes in rolling-over.. and may the good news match the stocks of your choice!)
- Additional to DJI/DJI futures for KLCI, daily forecast for stocks may be seen through today & yesterday candles. i.e. today candle seen comparatively rallying up within/through yesterday candle may show sign of better tomorrow, and vice-versa (collectively gap push-through consistent). In real time trading, RSI-MFI combined is popular among oscillators(for divergence, over-sold/bought indications and as companion to pacing indicators such as PSAR(4,20), 5-interval SMA/patterns/promotional patterns projection:))
- Short term/day-trader normally adopt consistent trading system/strategy, and at offbeat times believing in "Of the Thirty-Six Stratagems, fleeing is the best":) (market circulation: short selling(share recycling)<-> long buying(money recycling), e.g. pair of marubozu candlesticks or patterns to that effect)


* Pascal's wager and probability: Consider two mutually exclusive possibilities. If there is no god, then believing in him will be of little matter. However, if there is a god, then believing in him will bring you the infinite happiness of an eternity in heaven, and not believing in him will bring you the infinite unhappiness of an eternity in hell. So even if your subjective probability of god existing is arbitrarily small but greater than zero, your expected gain from believing that god exist will be infinite. We now understand that Pascal's reasoning is flawed since it depends on his particular listing of the possible states of the world. For example, another possibility is that if god exists, believers are sent to hell sine no human has enough information to conclude this is true, while doubters, who have the correct view given the information available, go to heaven. - excerpt from: A History of the Theory of Investment. M. Rubinstein (2006)
* Outline of an Intellectual Monster: the market cannot do without a state or state institutions .. - page 13, The Metaphysics of capitalism. Andrea Micocci (2009)
Discussions
Be the first to like this. Showing 0 of 0 comments
Post a Comment
Featured Posts
Introducing MY's First IPO Fund for Sophisticated Investors!
New Update. Discover investment communities that resonate with your ideas
M & A Value Partners IPO Equity Fund has been launched - Targeted 13% Return p.a
Latest Videos


Apps


Top Articles
1
2
Good Articles to Share
Eli Lilly CEO on Fighting Cancer and Obesity, Drug Pricing (Correct)
3
Good Articles to Share
Evercore ISI's Julian Emanuel says its too early to buy weakness
4
Good Articles to Share
5
Good Articles to Share
6
Good Articles to Share
7
Good Articles to Share
Tens of thousands demonstrate in nationwide strike in Belgium | REUTERS
8
Good Articles to Share
#
Stock
Score
Daily Stocks
Stock Name
Last
Change
Volume
Stock Name
Last
Change
Volume
Stock Name
Last
Change
Volume
MQ Trading Signals
Stock
Time
Signal
Duration
Stock
Time
Signal
Duration
Featured Advertisers / Partners


Ride The Bull Short The Bear
CS Tan
4.9 / 5.0
This book is the result of the author's many years of experience and observation throughout his 26 years in the stockbroking industry. It was written for general public to learn to invest based on facts and not on fantasies or hearsay....