


The Daily Pulse of Bursa Malaysia
Stock Analysis – PEKAT (0233) – RM0.520:

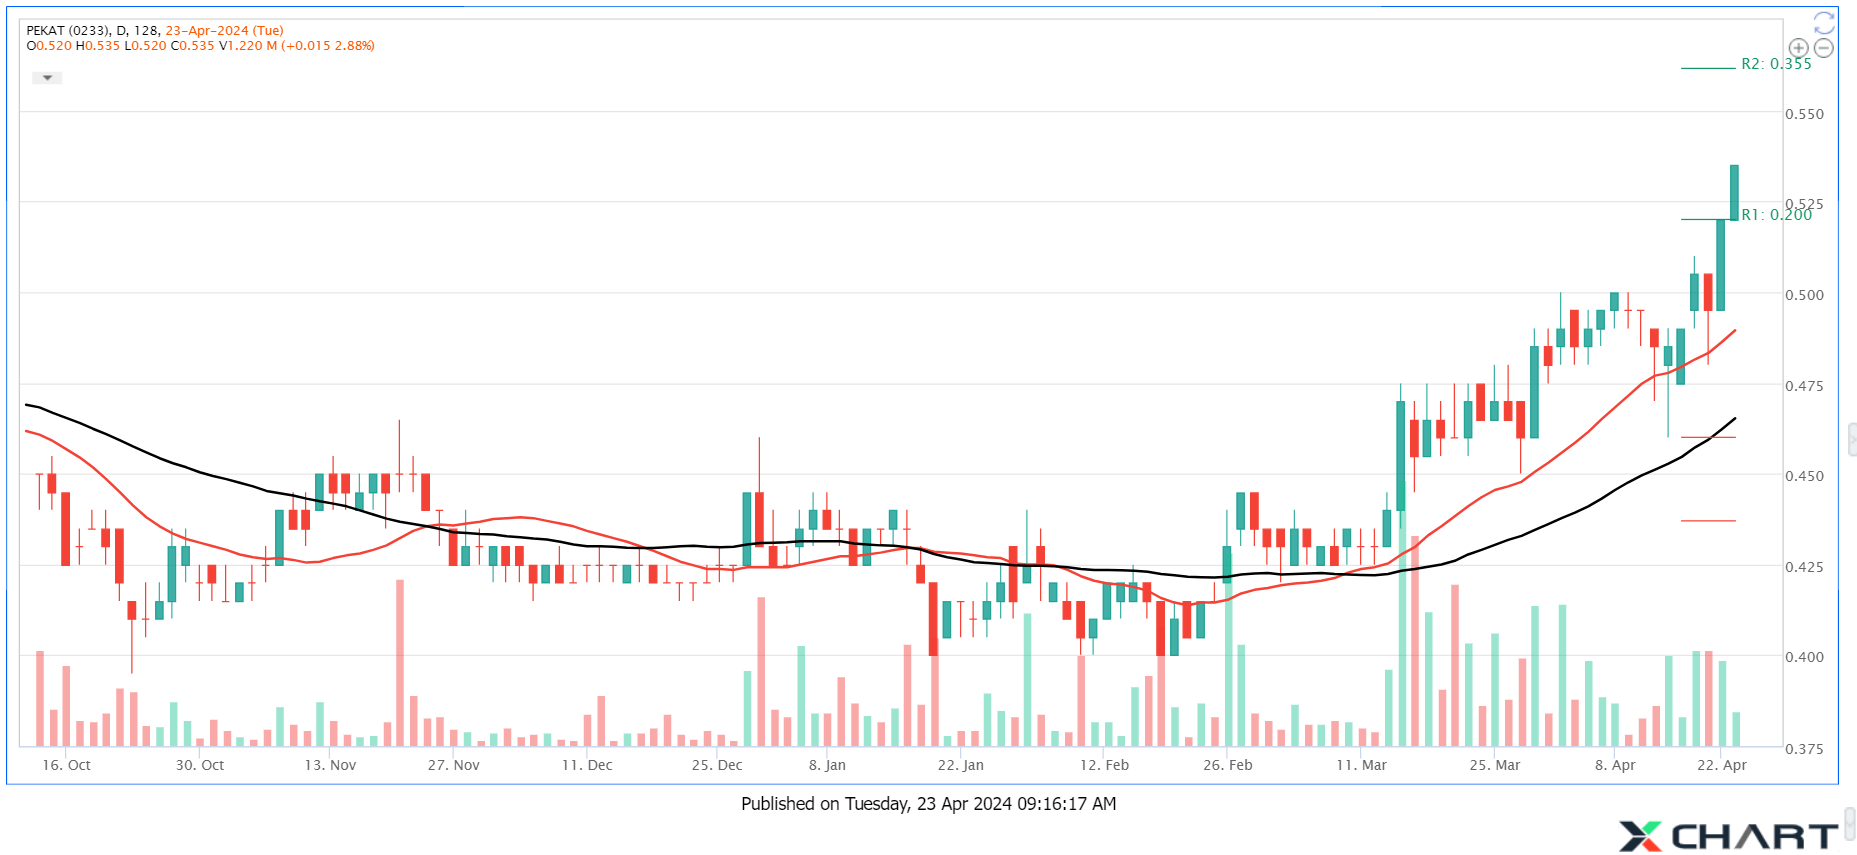
PEKAT’s stock price has gone through past 8 months of pullback consolidation stage along the sideway SMA200 line and the latest additional 1 month of gradual rebound and finally today the candlestick manages to breakout and stay above previous high above RM0.510 and close at RM0.520.
The stock price finally manages to stay above all short and medium terms’ EMA lines which riding above rising SMA200 line. This indicates that the stock price is finally taking off from its initial stage of markup phase;
If the stock price could stay above RM0.510 for higher high with trending momentum and increasing volume, then let’s monitor for the next possible short-term targets around RM0.550, 0.580, 0.600, 0.620, 0.650, 0.680, and 0.700.
Long term investors may prospect for possible long-term targets to challenge around RM0.720, 0.745, 0.775, 0.800, 0.820, 0.850, 0.880, 0.900, 0.920, 0.950, 0.980, and 1.00;
Should the new higher high beyond RM0.510 be successful, trailing stop with EMA20 or EMA30 line, or if the stock price were to pullback unexpectedly, put the short-term stop loss below RM0.480 or worst case below RM0.460;
The secondary indicators like MACD, DMI and RSI are at good junctures that may biased to lead the stock price for further upside and take off from its initial stage of markup phase;
“XChart’s Trade Signal” has been triggering 4 real times today afternoon as shown above indicating the stock on “CB06: Uptrend Intact and MD01: MACD (>0) crossing up signal line”;
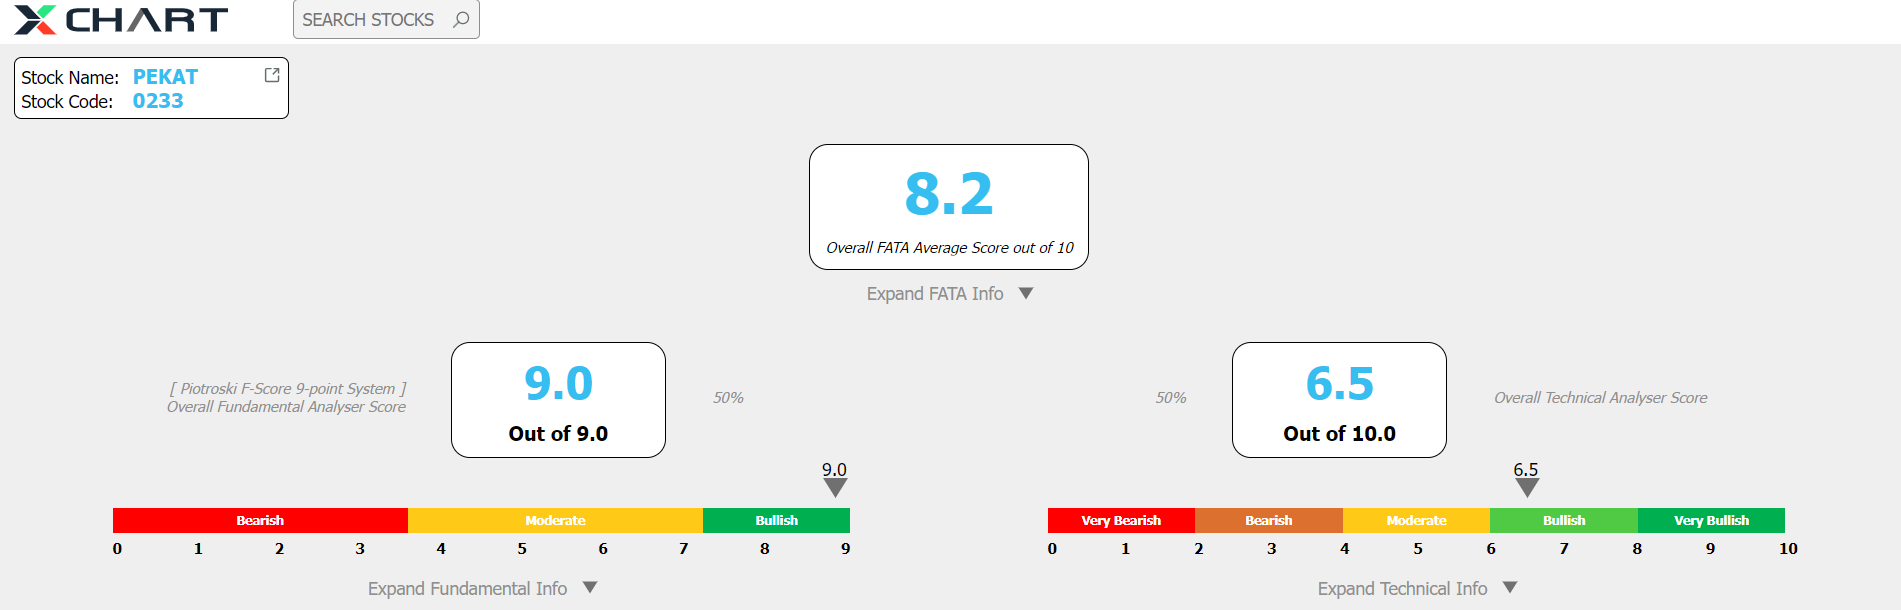
“XChart’s Stock Analyser” as shown above is fundamentally PFS9=9 indicates FA is extremely good, and technically TAS20>55% indicates that the stock price may biased for further upside after taking off the initial stage of its markup phase;
Fundamental:
PEKAT GROUP BERHAD (PEKAT, 0233) is listed under ACE market’s Industrial Products & Services Sector.
Principal Products / Services:
Solar Photovoltaic (PV) systems and power plants, Earthing and Lightning Protection systems, Electrical products and accessories.
Financial ratios:
TTM Q4-Dec-2023: DY%=1.92%, EPSG=9.28%, PER=24.53, ROE=10.02%, NGR=NetCash, DER-ST=0.01, TLER=0.30;
Related Stocks
| Chart | Stock Name | Last | Change | Volume |
|---|
More articles on The Daily Pulse of Bursa Malaysia
RHB Bank a laggard among banks, set to trend higher ?
Created by zaclim | Dec 18, 2024
RHB Bank Bhd has been inching higher after declining from a high in November. How high can it go?
Aemulus down but not out with gradual expansion in China
Created by zaclim | Dec 17, 2024
Aemulus Holdings Bhd has been dragged by news of its loss-making associate in China. Can the company salvage the situation?
Muhibbah Engineering counts on bright prospects to see price uptrend
Created by zaclim | Dec 16, 2024
Muhibbah Engineering (M) Bhd has not fared well in the just concluded 3Q. However, investors are banking on the counter to rise further.
Karex on a new high after touching year-low in January
Created by zaclim | Dec 16, 2024
Karex Bhd has been rapidly expanding its synthetic condom production, with first shipments already dispatched to Europe and plans underway to significantly scale up capacity.
Samaiden appears to be shining brighter backed by strong order book
Created by zaclim | Dec 13, 2024
Samaiden Group Bhd has been trending higher after falling to a low of 99.5 sen last month. It is expected to register better earnings supported by solid jobs in hand.
IOI Corporation does not offer much excitement to investors but things could change
Created by zaclim | Dec 13, 2024
IOI Corporation Bhd is on upward trajectory, albeit a minor one. Things are likely to look positive but its performance hinges an many things
Sealink to charter new height with turnaround in sight
Created by zaclim | Dec 04, 2024
Sealink International Bhd has seen a positive run in its share price after retracing from a high of 42 sen in Aug. With better prospects expected, the counter is likely to move higher.
Ranhill Utilitites poised for more jobs, upside expected
Created by zaclim | Dec 03, 2024
Ranhill Utilities Bhd has seen its share price trending higher after touching a low of RM1.30 some two weeks ago. WIth higher demand for utilities, will the counter see sustained upside?
Will Asia File see a turnaround to trend higher?
Created by zaclim | Dec 02, 2024
Asia File Corporation Bhd has seen better financial numbers in recent years but its main filing products have experienced slower sales.
Leong Hup shows promise of further uptrend
Created by zaclim | Dec 02, 2024
Leong Hup International Bhd rose to a high of 77.5 sen recently. There are signs of the counter rising further after enjoying improved margins.
Discussions
Be the first to like this. Showing 0 of 0 comments
Post a Comment
Featured Posts
Introducing MY's First IPO Fund for Sophisticated Investors!
New Update. Discover investment communities that resonate with your ideas
M & A Value Partners IPO Equity Fund has been launched - Targeted 13% Return p.a
Latest Videos


MQ Trading Signals
Time
Signal
Duration
Type
2024-12-19 15:30:00
EMA 5
30 Mins
BUY
2024-12-19 15:00:00
EMA 5
Hourly
BUY
2024-12-19 14:40:00
TURTLE SYSTEM 20
10 Mins
SELL
2024-12-19 14:40:00
TURTLE SYSTEM 55
10 Mins
SELL
2024-12-19 14:40:00
TURTLE SYSTEM 20
5 Mins
SELL
Apps


Top Articles
1
2
Stock Market Enthusiast
3
4
7
TA Sector Research
8
Good Articles to Share
Kamala Harris makes this clear during speech to supporters #shorts
#
Stock
Score
Daily Stocks
Stock Name
Last
Change
Volume
Stock Name
Last
Change
Volume
Stock Name
Last
Change
Volume
Featured Advertisers / Partners


Ride The Bull Short The Bear
CS Tan
4.9 / 5.0
This book is the result of the author's many years of experience and observation throughout his 26 years in the stockbroking industry. It was written for general public to learn to invest based on facts and not on fantasies or hearsay....