


Emerging Asia
Does Malaysia Economy do well since 2000?

| Malaysia | Population | Indonesia | Population | |||
| Year | Value $ | GDP % | (Mil) | Value $ | GDP % | (Mil) |
| 2000 | 93,789,736,842.11 | 8.6 | 165,021,012,077.81 | 4.8 | ||
| 2001 | 92,783,947,368.42 | 0.3 | 160,446,947,784.91 | 3.3 | ||
| 2002 | 100,845,263,157.90 | 4.2 | 195,660,611,165.18 | 3.5 | ||
| 2003 | 110,202,368,421.05 | 5.2 | 234,772,463,823.81 | 4.1 | ||
| 2004 | 124,749,736,842.11 | 7.1 | 256,836,875,295.45 | 4.9 | ||
| 2005 | 143,534,102,611.50 | 5.2 | 285,868,618,224.02 | 5.6 | ||
| 2006 | 162,690,965,596.21 | 5.9 | 364,570,514,304.85 | 5.5 | ||
| 2007 | 193,547,824,063.30 | 6.3 | 26.80 | 432,216,737,774.86 | 6.3 | 225.60 |
| 2008 | 230,813,597,937.53 | 4.6 | 27.30 | 510,228,635,279.29 | 6.1 | 231.60 |
| 2009 | 202,257,586,267.56 | -1.7 | 27.80 | 539,580,088,908.14 | 4.5 | 235.00 |
| 2010 | 255,016,609,232.87 | 7.2 | 28.30 | 755,094,160,363.07 | 6.1 | 238.50 |
| 2011 | 297,951,960,784.31 | 5.1 | 29.06 | 892,969,107,923.09 | 6.5 | 242.00 |
| 2012 | 314,442,825,692.83 | 5.6 | 29.51 | 917,869,910,105.75 | 6.2 | 245.40 |
| 2013 | 323,276,841,537.34 | 4.7 | 30.21 | 912,524,136,718.02 | 5.3 | 248.80 |
| 2014 | 338,068,990,803.26 | 6.0 | 30.60 | 890,814,755,233.23 | 5.0 | 252.20 |
| 2015 | 296,283,190,372.55 | 5.0 | 31.20 | 861,256,351,277.36 | 4.9 | 255.46 |
| 2016 | 296,359,118,754.53 | 4.2 | 31.70 | 932,259,177,765.31 | 5.0 | 258.70 |
| Thailand | Population | Philipines | Population | |||
| Year | Value $ | GDP % | (Mil) | Value $ | GDP % | (Mil) |
| 2000 | 126,392,308,497.75 | 4.1 | 81,026,297,144.28 | 3.6 | ||
| 2001 | 120,296,746,256.63 | 1.4 | 76,262,072,022.22 | 2.8 | ||
| 2002 | 134,300,851,255.00 | 5.2 | 81,357,602,950.18 | 4.6 | ||
| 2003 | 152,280,653,543.73 | 6.7 | 83,908,206,456.06 | 4.5 | ||
| 2004 | 172,895,476,152.59 | 6.1 | 91,371,239,764.88 | 5.9 | ||
| 2005 | 189,318,499,954.00 | 4.5 | 103,071,585,462.60 | 4.8 | ||
| 2006 | 221,758,486,880.31 | 4.8 | 122,210,719,245.90 | 5.4 | ||
| 2007 | 262,942,650,543.77 | 4.8 | 63.04 | 149,359,920,005.89 | 7.3 | 88.71 |
| 2008 | 291,383,081,231.82 | 2.6 | 63.39 | 174,195,135,053.12 | 3.8 | 90.46 |
| 2009 | 281,710,095,724.76 | -2.2 | 63.53 | 168,334,599,538.17 | 1.1 | 91.02 |
| 2010 | 341,105,009,515.33 | 7.8 | 63.88 | 199,590,774,784.58 | 7.3 | 92.60 |
| 2011 | 370,818,747,396.83 | 0.1 | 64.08 | 224,143,083,706.78 | 3.7 | 94.80 |
| 2012 | 397,559,992,407.45 | 6.4 | 64.06 | 250,092,093,547.53 | 6.6 | 97.10 |
| 2013 | 420,528,737,876.72 | 2.9 | 64.46 | 271,836,123,723.68 | 6.8 | 98.00 |
| 2014 | 406,521,561,093.36 | 0.8 | 64.79 | 284,584,522,898.94 | 6.1 | 100.50 |
| 2015 | 399,234,547,137.47 | 2.9 | 65.12 | 292,774,099,014.19 | 6.0 | 102.20 |
| 2016 | 406,839,679,301.94 | 3.2 | 65.93 | 304,905,406,845.91 | 6.9 | 103.90 |
| Singapore | Population | China | Population | |||
| Year | Value $ | GDP % | (Mil) | Value $ | GDP % | (Mil) |
| 2000 | 126,923,095,471.91 | 10.1 | 1,211,346,395,438.73 | 8.0 | ||
| 2001 | 127,212,731,119.31 | -2.2 | 1,339,395,440,432.04 | |||
| 2002 | 136,256,691,925.27 | 2.2 | 1,470,549,716,080.71 | 8.0 | ||
| 2003 | 162,766,467,544.72 | 1.1 | 1,660,287,543,796.06 | 8.0 | ||
| 2004 | 196,053,942,193.91 | 8.1 | 1,955,347,477,285.91 | 9.1 | ||
| 2005 | 234,022,949,884.06 | 6.4 | 2,285,965,854,313.36 | 9.1 | ||
| 2006 | 271,974,858,948.52 | 7.9 | 2,752,132,089,196.58 | 10.2 | ||
| 2007 | 326,343,861,812.68 | 7.7 | 4.59 | 3,552,182,714,426.55 | 11.9 | 1321.29 |
| 2008 | 393,489,345,339.15 | 1.1 | 4.84 | 4,598,205,419,718.80 | 9.0 | 1328.02 |
| 2009 | 336,886,290,580.52 | -1.3 | 4.99 | 5,109,954,035,775.98 | 9.1 | 1334.50 |
| 2010 | 387,290,741,084.78 | 14.5 | 5.08 | 6,100,620,356,557.32 | 10.3 | 1340.91 |
| 2011 | 469,287,734,302.83 | 4.9 | 5.18 | 7,572,554,360,442.62 | 9.2 | 1347.35 |
| 2012 | 489,309,844,392.05 | 1.3 | 5.31 | 8,560,546,868,811.69 | 7.8 | 1354.04 |
| 2013 | 508,115,793,399.22 | 4.1 | 5.40 | 9,607,224,248,684.59 | 7.7 | 1360.72 |
| 2014 | 521,843,492,853.73 | 3.6 | 5.47 | 10,482,371,325,324.70 | 7.3 | 1367.82 |
| 2015 | 444,166,579,289.30 | 1.9 | 5.54 | 11,064,664,793,255.70 | 6.9 | 1374.62 |
| 2016 | 431,168,068,762.38 | 1.9 | 5.60 | 11,199,145,157,649.20 | 6.7 | |
*Data get from some internet sources and accuracy not 100%.
1. On average for the past 17 years, Malaysia GDP growth 4.91%, Indonesia 5.15%, Thailand 3.65%, Phillipines 5.13%, Singapore 4.31%, China 8.14%. On economy size Singapore and Thailand are much more larger than Malaysia, and Philippines is slightly larger than Malaysia.
2. Therefore just from economy size point of view, Malaysia actually growth not so well or is below our expectation for the past 17 years. This is due to we use to compare with Taiwan, Singapore and South Korea but now we are actually just nice to compare with Thailand, Phillipines and Vietnam.
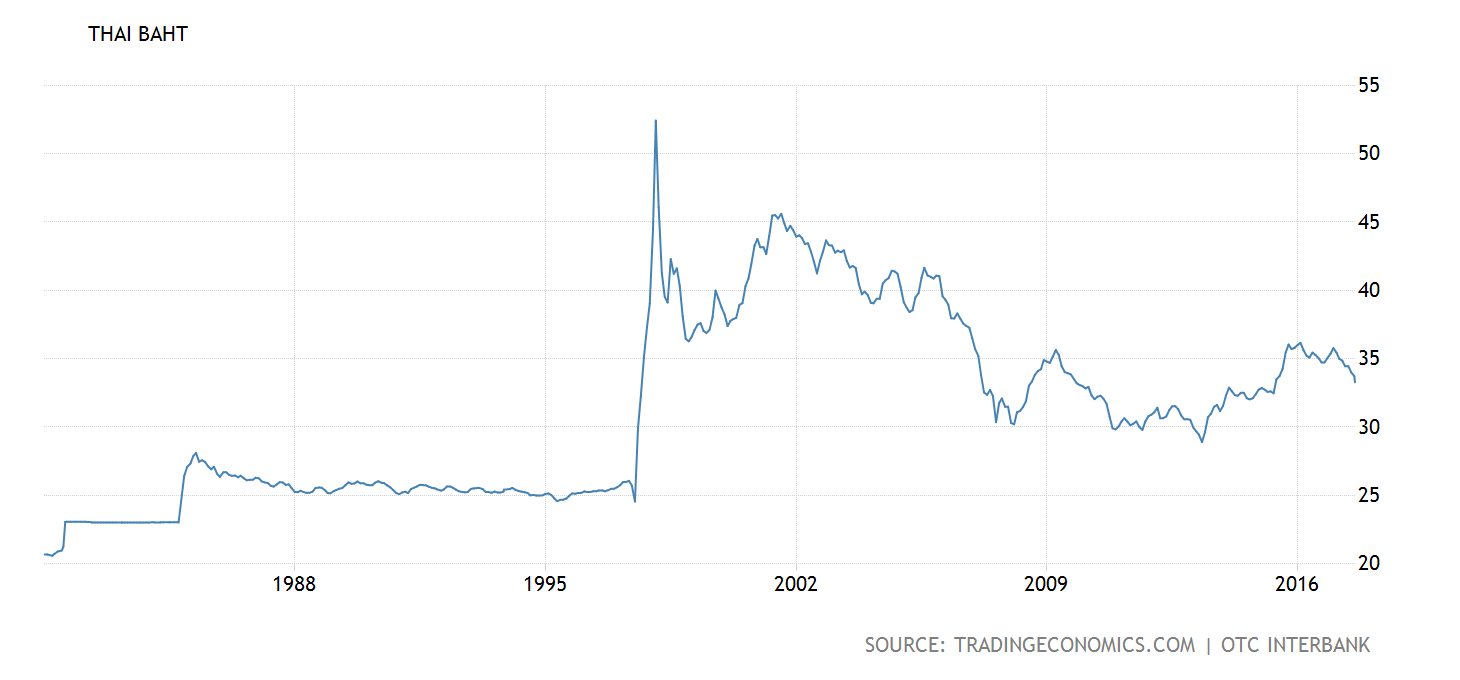
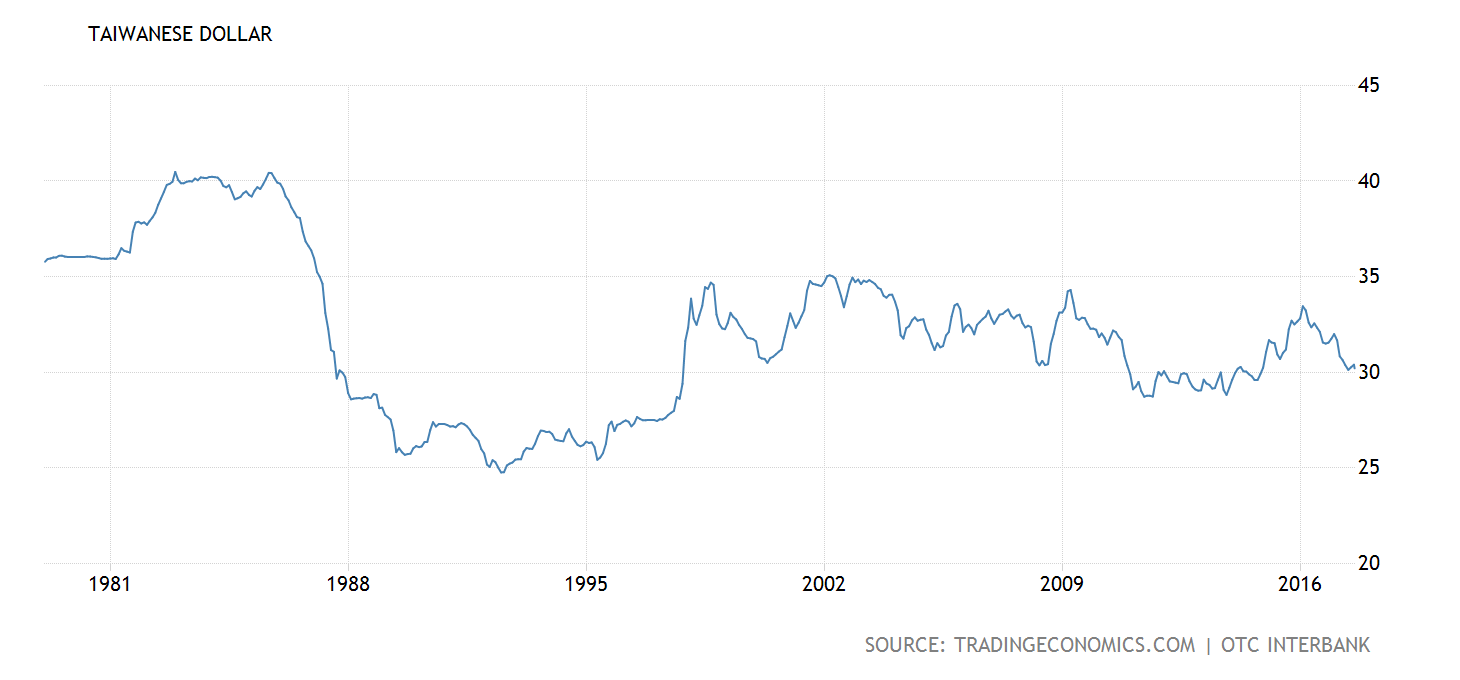
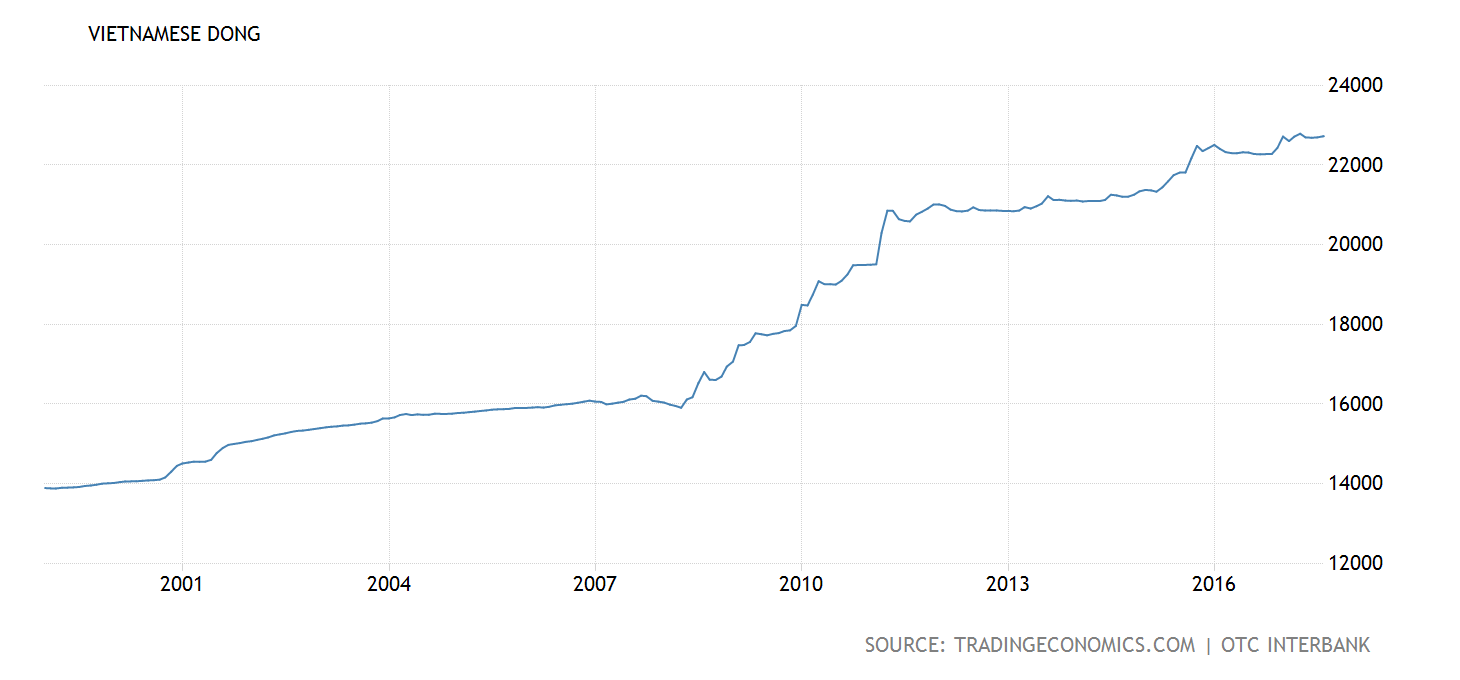
3. Another reason which bring Malaysia people feel more down or suffer in their life which we find out is currency - Ringgit Malaysia. Let us have some comparison :
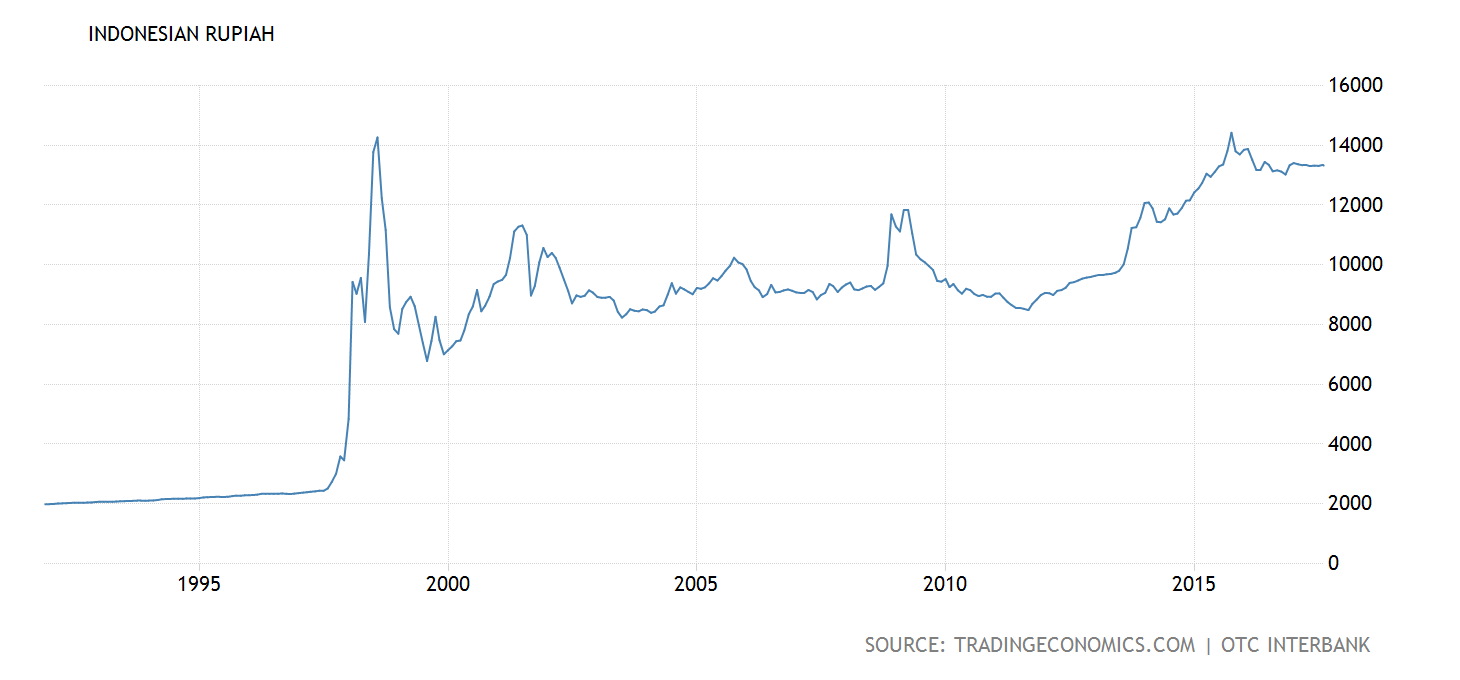
Indonesia Rupiah - poor performance as well compare like year 1997.
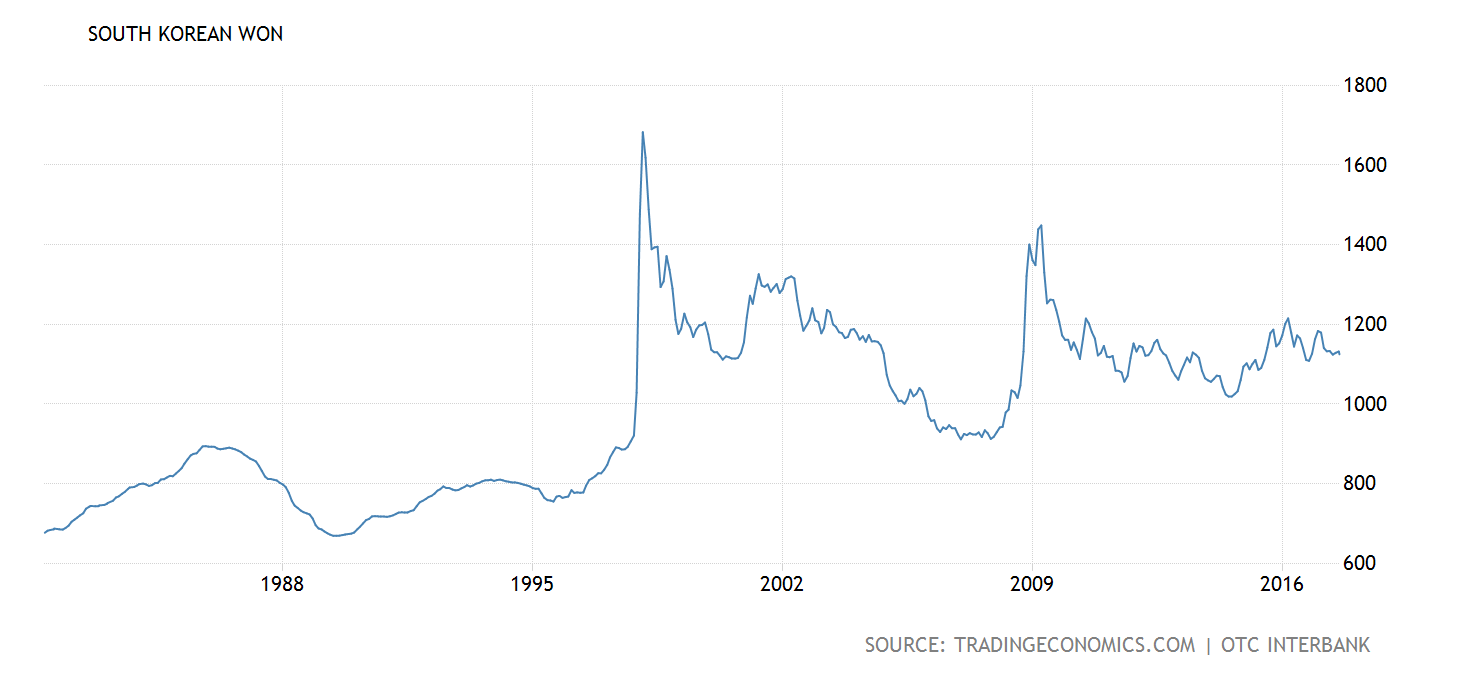
South Korean Won - still perform better compare to year 1997.
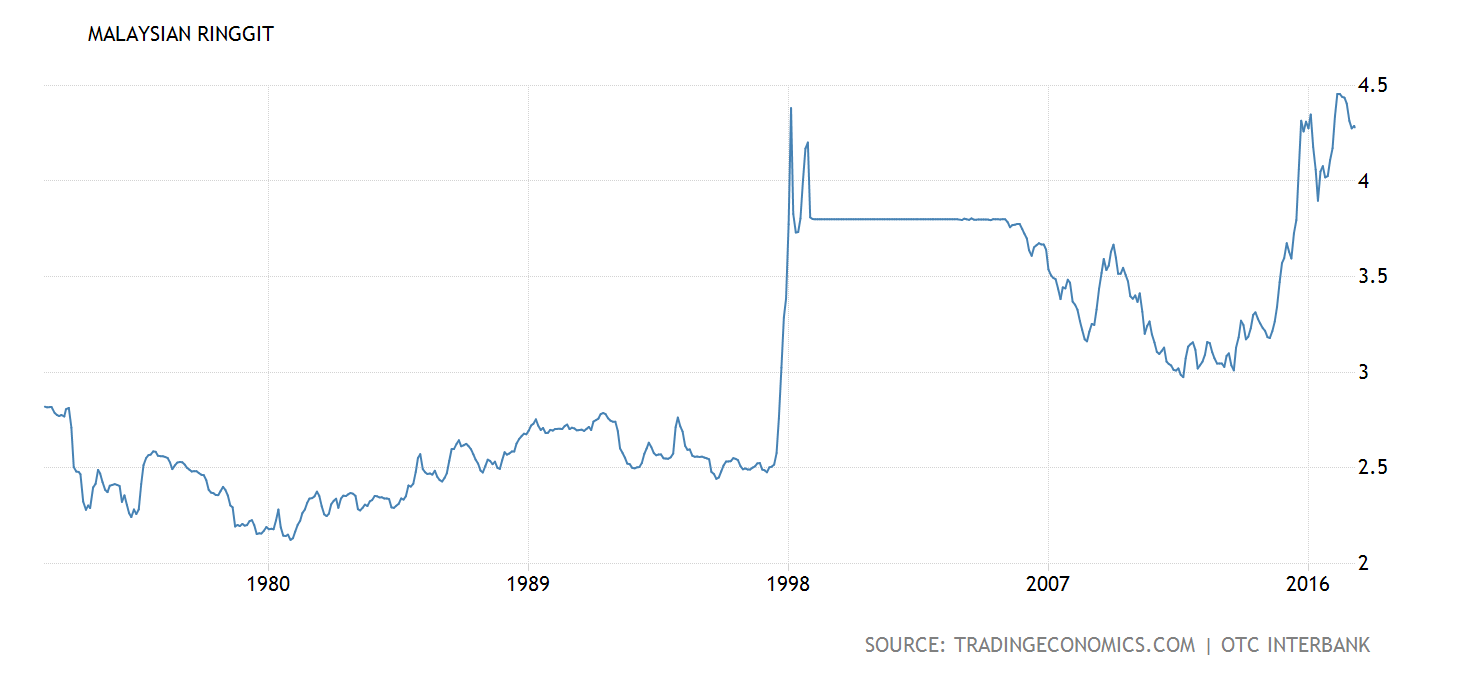
Malaysia Ringgit - poor performance as worst as year 1997.
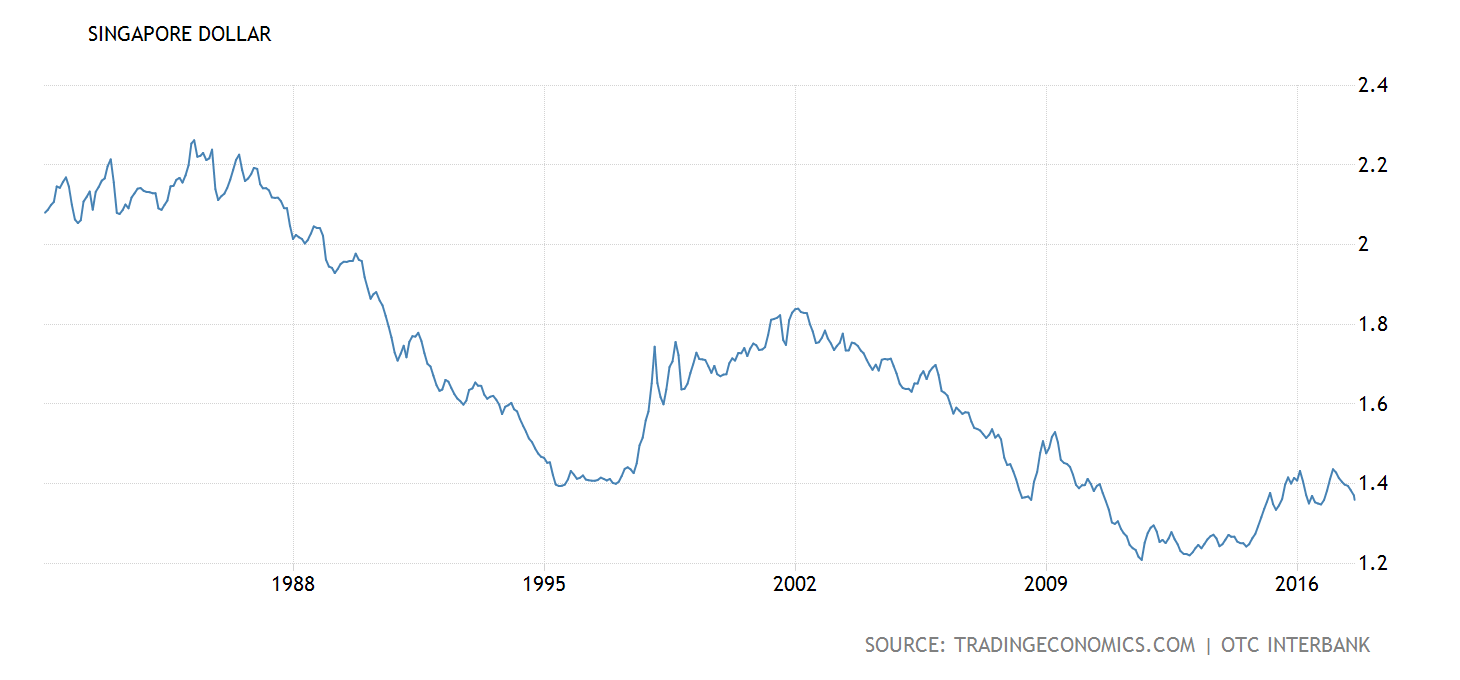
Singapore Dollar - well perform until now.
Thai Baht - perform better than 1997 crisis
Taiwanese Dollar - maintain at current level, stagnant for long time.
Vietnamese Dong - poor performance as well.
4. USD is the major currency we use even until today, to judge FDI normally we will look at countries foreign reserve. Therefore exchange rate stand as an indicator which show foreign investor either buying or selling your country assets like bond or securities. As a simple conclusion we can get is foreigner actually pull out a lot of investment in Malaysia and Malaysia economy actually not well perform in their point of view.
以上纯属个人分析与评论,如有任何疑问,欢迎与我交流讨论。任何股票买卖建议输赢绝对不负责。
More articles on Emerging Asia
Discussions
Be the first to like this. Showing 2 of 2 comments
Post a Comment
Featured Posts


Latest Videos


Apps


Top Articles
1
2
My Trading Adventure 2025
3
Double Swords 双剑论股
4
Double Swords 双剑论股
5
Double Swords 双剑论股
6
My Trading Adventure 2025
7
Double Swords 双剑论股
8
Double Swords 双剑论股
#
Stock
Score
Daily Stocks
Stock Name
Last
Change
Volume
Stock Name
Last
Change
Volume
Stock Name
Last
Change
Volume
MQ Trading Signals
Stock
Time
Signal
Duration
No trading signals available.
Stock
Time
Signal
Duration
No trading signals available.
Featured Advertisers / Partners


Ride The Bull Short The Bear
CS Tan
4.9 / 5.0
This book is the result of the author's many years of experience and observation throughout his 26 years in the stockbroking industry. It was written for general public to learn to invest based on facts and not on fantasies or hearsay....
limch
Meaning after Tun Mahathir resigned as PM our economy become worse?
2017-08-08 11:49