


Eren Thinks
CCK- 2018 Expect Another Robust Year

Introduction
CCK Consolidated Holdings Berhad ("CCK") is principally involved in retail, poultry and prawn industries. The business operates more than 50 CCK stores throughout Sarawak, Sabah, Peninsular Malaysia and subsidiaries in Indonesia mainly selling fresh chickens and cold storage products. CCK also operates integrated poultry farming and processing mostly serving Malaysia and Indonesia markets. Lastly, CCK operates about 40 ponds specifically for prawn agriculture and processing using the latest technology mostly for exporting to overseas market namely Australia, Hong Kong, Japan and Indonesia. Throughout eleven years of operation, the company is growing exceptionally and has become the largest poultry supplier in Sarawak.
Retails and poultry segments comprise about 95% of sales retail segment (76%) and poultry (19%).
Key Opportunities in 2018
Since CCK involves in poultry business, CCK is expected to benefit from current low global corn and soy prices and couple with strengthening of MYR against USD, the company will enjoy better margin. Retail segments is also expected to benefit from lower cost imported products.
2018 is the election year, it is widely expected that the ruling party through government spending and political party activities will continue to focus on Sabah and Sarawak regions to defend their turf against opposition parties. These bode well for CCK as the spillover effects from election theme activities will spur the consumer spending in the regions.
Financial Performance
Based on Q3 FYE17 financial results, gross profit increased to 23.8% as opposed to 18.2% QoQ and cumulative 20.5% as opposed to 18.7% YoY. The Net Profit increment was 18% QoQ and 30% cumulative YoY. The EPS improved by close to 50% cumulative YoY.
Management pointed out that the revenue improvement brought by better performance in Indonesian operations, lower feed costs and higher margin for fresh chicken and table eggs. The retail segments shown 12% improvement in revenue aided by better table eggs pricing and lower feed costs.
Looking back at the financial history of CCK:-
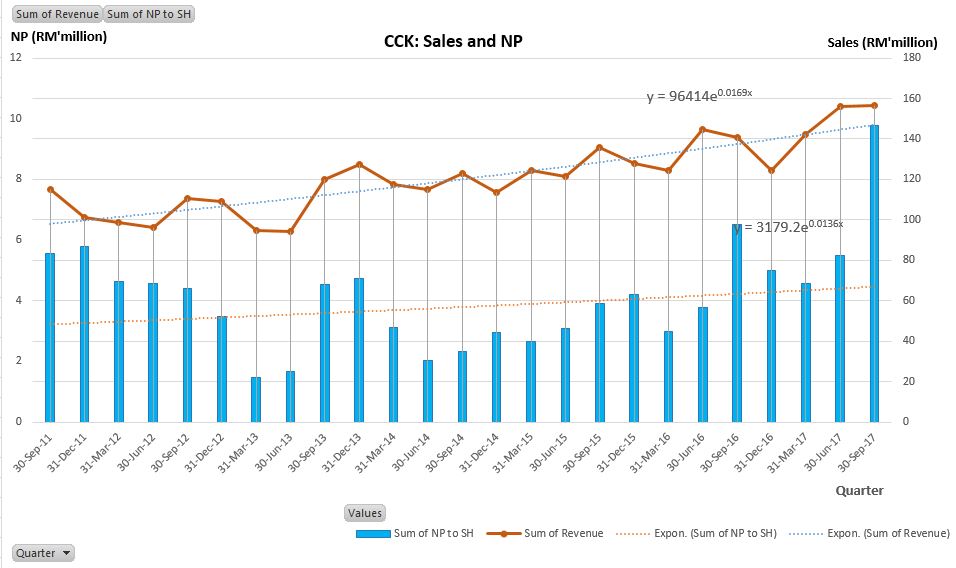
This chart is constructed from quarterly financial results of CCK of from 2011 until latest quarterly financial result FYE 2017. As can be seen, over the years CCK continued to grow sustainably and deliver profits every quarter. This showed the management competent in managing the business as well as its flexibility to manoeuvre the financial capabilities . From this chart I work out that the average annual sales growth was 7% and the net profit to shareholders on average growed at 5.5% per annum. However, since what I want to do here is to value the share worth, I need to take the figure into per share basis.
Below is the adjusted financial results per share basis based on the latest number of shares outstanding: 315 million units.
| AQR | T4Q | 31/12/2016 | 31/12/2015 | 31/12/2014 | 31/12/2013 | CAGR | |
| RPS | 192.36 | 183.68 | 169.24 | 161.42 | 143.1 | 138.17 | 7.42% |
| EPS | 8.39 | 7.88 | 5.8 | 4.4 | 2.63 | 2.36 | 25.21% |
| DPS | 0 | 0 | 2 | 1.50 | 0.750 | 1.75 | - |
| NAPS | 0.7739 | 0.7739 | 0.7361 | 0.6895 | 0.5157 | 0.4516 | 23.66% |
Over the years there were some changes in number of shares and the most significant one was in FYE 2016 when the company issue bonus share on 1 to 1 basis. So, in per share basis, for FYE 2013 to 2016 I work out that the annual growth in sales is 7.4%, however, the EPS grow faster at 25% per annum which is make sense given the small base impact plus as the company grow bigger it is not uncommon that the company will able to integrate and manage the operation much more efficiently, economies of scale.
However, since May 2017 I can't help but notice that the company share price skyrocketed by up to 51%, to try to explain this, I will place special attention on the most recent financial results to see how logical the share price movement was.
Recent Years Growth
| T4Q | 2016 | 2015 | |
| Revenue Per Share (% YoY) | 8.5 | 4.8 | 12.8 |
| Earning Per Share (%Yoy) | 35.9 | 31.8 | 67.3 |
The evidence is clear, there were explosive growth in EPS over the last few years although the revenues grown moderately.
Financial Health
Based on Q3 FYE17 financials. cash level stood at RM21 million as oppose to RM14.5 million in the same period FYE16, this can be translated into 7 sen per share.
Looking at debt level, the long term debt is rather minimal but short term debt is substantial, representing about 36% of total current assets, and the level stood at RM56 million. AR 2016 also showed the current debt at around the same level. This is an evidence that short term banking facilies plays an important role in day to day CCK operations. This give rise to question about the cash conversion cycle at CCK. CCC is an important number find out the effectiveness company to convert its cash into working capital and back into cash. I find out that:-
Q3 2017
Days sales outstanding = 35 days
Days in Inventory = 75 days
Days Payables Outstanding = 23 days
Cash Conversion Cycle= 87 days
Q3 2016
DSO= 60 days
DII= 74 days
DPO= 32 days
CCC= 103
It is by no means that the figure above represents full year CCC, because the figures above only take into account financial figures up to 3rd quarter financial results only. The full year figures would be much lower, as an example 2016 full year CCC is 74 days not 103 days as shown for 3Q 2016 above.
No wonder the company needs short term banking facilities, because it takes up to 3 months and sometimes more for the company to convert cash from purchases of raw materials to sales and back into cash again.
Overal the financial position is healthy, there is no substantial long term debt, and current cash level is more than enough to cover the debt. For the short term debts, as long as the company able to operate the business as usual, it safe to assume that the short term debts are already covered by the current assets (receivables and inventories).
Conclusion
Given the good factors in 2018, I continue to expect CCK to deliver stellar financial profits this year. Currently the company do not have any treasury shares because all were sold last year, but the mandate for share buyback is still active and given the current cash level, the company can reward the shareholders by executing share buyback including paying some dividends.
Current, weakness in share price is the perfect opportunity to accumulate the shares. Based on forecasted FYE 2018 EPS of 12.3 sen per share, I arrive at my target price of RM1.60 (30% upside potential), 13 times forward PE.
Related Stocks
| Chart | Stock Name | Last | Change | Volume |
|---|
More articles on Eren Thinks
IPO Binasat Communications Berhad (BINACOM): Attractive price and high growth potential
Created by Erentitan | Dec 26, 2017
Kejuruteraan Asastera Berhad Balloting- Retail Offering oversubcribed by 57 times
Created by Erentitan | Nov 14, 2017
Featured Posts


Latest Videos


Apps


Top Articles
1
Kenanga Research & Investment
Technology - Export Restrictions and Tariff Threats (OVERWEIGHT)
2
Good Articles to Share
CEOs are 'overall optimistic' on US economy under Trump: Boston Consulting Group
3
4
Good Articles to Share
5
RHB Investment Research Reports
6
Good Articles to Share
7
Good Articles to Share
8
Good Articles to Share
#
Stock
Score
Daily Stocks
Stock Name
Last
Change
Volume
Stock Name
Last
Change
Volume
Stock Name
Last
Change
Volume
Featured Advertisers / Partners


Ride The Bull Short The Bear
CS Tan
4.9 / 5.0
This book is the result of the author's many years of experience and observation throughout his 26 years in the stockbroking industry. It was written for general public to learn to invest based on facts and not on fantasies or hearsay....