


Invest Made Easy
A Guide Towards Understanding Unit Trust Performance Table

Shane My
Publish date: Mon, 21 Jan 2013, 12:27 AM
Shane My
0 271
Like many of us, we seek for financial security and ultimately financial freedom. This blog is intended to act as a journal of investment as I journey towards that dream. At the same time, I hope that the articles written here would also benefit many others who share the same vision as me.
| Blank Face!! |
A few days ago, I showed a friend of mine the Top 10 Best Performing Unit Trust Funds As of 15th January 2013. Immediately he gave me that blank look. The type one gets when feeling absolutely clueless about what our local politicians are talking about. What went wrong? What happened?
I then realize that showing a Unit Trust performance table containing figures was meaningless to someone who has little knowledge on this subject. Then it occurred to me that some readers might face the same problem as well. Honestly if I had no exposure to unit trust performance, I would look for something else to do instead of trying to figure out what these numbers and jargons meant!


YTD??
Fund Price??
1mth (%)??
Annualized??
In this post, I will try my best to explain the meaning of these jargons and how they can help you to understand a Unit Trust Performance Table better.
Let's begin by looking at a sample Unit Trust Performance Table shown below:
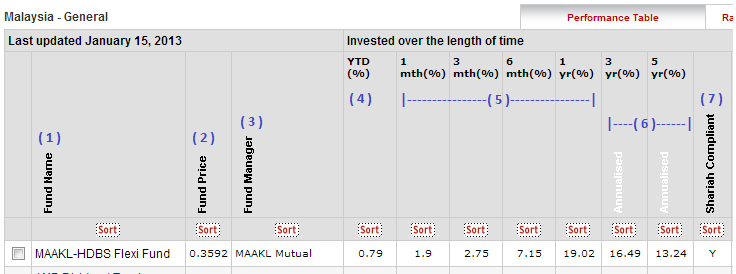
Definition according to the number tagged in the picture above:
( 1 ) Fund Name
Duh! Basically this refers to the name of a specific Unit Trust Fund.
( 2 ) Fund Price
When investing in Unit Trust, we are in fact purchasing "units" based on the fund's price. Fund price changes on a day to day basis based on the calculation which I will explain next.
Determining the Fund Price
Fund price also commonly known as the Net Asset Value (NAV) per unit is calculated by adding up the current value of all the stocks, bonds, and other securities (including cash) in the fund's portfolio, subtracting out certain daily expenses of running the fund (e.g the management fees, trustee fee, and other operating expenses) and then dividing that figure by the fund's total number of units. A fund price is always calculated at the end of each business day.
For example, Fund X intends to calculate the fund price per unit at the end of a business day with the following information:
a) Asset at end of business day : RM48,200,000
b) Liability at end of business day : RM200,000
c) Total number of units : 8,000,000 units (referring to the units purchased by investors)
Fund price per unit : (RM48,200,000 - RM200,000) / 80,000,000 units = RM0.60/unit
On the following business day, investors can then purchase units from this fund at the price of RM0.60/unit.
( 3 ) Fund Manager
The organization / company responsible for implementing a fund's investment strategies and managing its portfolio trading activities. If you read deeper into a Unit Trust Fund prospectus you will also find the individual / person in charge of managing your fund.
( 4 ) YTD (%)
YTD is short for Year To Date. YTD (%) is the percentage difference between the Fund Price on the last day of last year to the Fund's latest closing price.
Sample calculation as follows:
a) Fund Price for ASM Balanced Fund on 31 Dec 2012 : RM0.7296 /unit
b) Fund Price for ASM Balanced Fund on 18 Jan 2013 : RM0.7319 /unit
% Year To Date : (RM0.7319 - RM0.7296) / RM0.7296 X 100% = 0.32%
When looking at YTD (%), we are comparing the latest performance of the fund against the benchmark price of the previous year.
( 5 ) 1 mth (%), 3 mth (%), 6 mth (%) and 1 yr (%)
Somewhat similar to YTD (%), but with a little twist to it. For example when looking at the performance table of Unit Trust as of 15th January 2013, the 1 mth (%) is the percentage difference between the fund price on 15th January 2013 with the price of the same fund a month ago (15th Dec 2012).
3 mth (%) : Percentage difference between the price on 15th January 2013 with price on 15th Oct 2012
6 mth (%) : Percentage difference between the price on 15th January 2013 with price on 15th July 2012
1 yr (%) : : Percentage difference between the price on 15th January 2013 with price on 15th January 2012
( 6 ) 3 yrs (%) and 5 yrs (%) annualized
When investing into unit trust, we should be aware that performance of a fund varies from year to year. Profits and losses are indicated by the comparing the percentage difference of the fund's NAV for one financial year to the previous financial year. Different funds have different financial year end and should not to be confused with our normal calender year end of 31st December.
Let's take a look at a sample fund below.
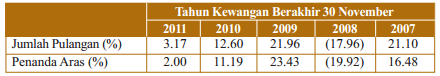
Referring to table row for "Jumlah Pulangan (%)", we see that as by financial year end 30th November 2011, this fund posted 3.17% growth on NAV from the previous financial year. For 2010, the growth is 12.60% and 21.96% for 2009. During the 2008 economy downturn, the fund posted -17.96% losses from its previous year NAV. Clearly profit and loss for any unit trust fund tend to vary from one financial year to the other.
To compare funds using actual year performance such as the one above is rather difficult due to different financial year of each unit trust fund. Furthermore, yearly comparison does not reflect the overall objective of evaluating the long term performance of a unit trust fund.
Hence when it comes to comparing performance of unit trust funds for duration longer then one year, each unit trust performance are "annualized" to reflect the average performance per year of a fund with reference to a specific date.
For example, whenever you read or hear that a fund returns 10% over a period of 3 years (%) annualized as of 31st December 2012, the information should be perceived as average 10% returns every year measured on the 31st of December for the past 3 years..
5 yrs (%) annualized is similar to the 3 years concept except that the duration of average returns is over a period of 5 years.
( 7 ) Shariah Compliant
A shariah compliant fund is denoted by "Y" and a non-shariah compliant fund is denoted by "N".
What is Shariah Compliant Fund?
Shariah compliant funds must invest according to the Shariah law as well as abide to the guideline of Islamic Finance. Shariah compliant funds provide an opportunity for our fellow Muslim friends to partake in unit trust investment without worrying if profits are obtained from non-halal sectors such as gambling and liquor.
Summary
I hope this guide has somehow wiped that blank look of your faced helped you to understand better about the Unit Trust Performance Table. If you have any questions, feel free to post at the comment section.
Cheers and happy investing!
If you like what you've just read, please:
1. Share this article on your Facebook!
2. Like my Facebook Page
3. Subscribe to me. See the "FOLLOW ME TO FINANCIAL FREEDOM" section located at the top left? Just key in your email and click Submit.
4. Visit my blog for other articles on investment at http://invest-made-easy.blogspot.com/
2. Like my Facebook Page
3. Subscribe to me. See the "FOLLOW ME TO FINANCIAL FREEDOM" section located at the top left? Just key in your email and click Submit.
4. Visit my blog for other articles on investment at http://invest-made-easy.blogspot.com/
More articles on Invest Made Easy
IME versus Market Analyst - Fun with Predicting UWC's Target Price
Created by Shane My | Dec 06, 2020
Featured Posts


Latest Videos


Apps


Top Articles
1
Stock Pick Contest Year 2024
2
https://dividendguy67.blogspot.com
3
Koon Yew Yin's Blog
4
5
save malaysia!
6
Mercury Securities Research
7
Good Articles to Share
8
angelinestment
#
Stock
Score
Daily Stocks
Stock Name
Last
Change
Volume
Stock Name
Last
Change
Volume
Stock Name
Last
Change
Volume
MQ Trading Signals
Stock
Time
Signal
Duration
Stock
Time
Signal
Duration
Featured Advertisers / Partners


Ride The Bull Short The Bear
CS Tan
4.9 / 5.0
This book is the result of the author's many years of experience and observation throughout his 26 years in the stockbroking industry. It was written for general public to learn to invest based on facts and not on fantasies or hearsay....