


iVSA Trading Tips and Plans
iVSA Article 18 - Ten Signals of Rising Stock

Introduction
To be a winning trader or investor, the skill to identify signal of rising stocks is crucial to increase the chances of having successful trade or investment when taking a position. Similar to previous “iVSA Article 17 - Ten Warning Signs of Declining Stock” http://klse.i3investor.com/blogs/ivsatradingtipsandplans/101582.jsp, a rising stock can also be divided into two categories, which are rising in long term or short term.
Reason for a share to rise in long term is usually related to its financial fundamentals, therefore a fundamental analysis approach is used to detect its long term movements. On the contrary, reason for a share to rise in short term are usually due to smart money involvements, therefore a technical analysis approach is used to detect these short term movements. We shall discuss five basic points for each of these categories.
Signals of Rising Stock– LONG TERM
1. Increasing Revenue
If a company’s revenue has been increasing for 3 or more consecutive years, it indicates that the company is gaining expanding its business and growing its sales revenue. It may also be due to the industry that the company belongs to is experiencing a boom for that period.
Although increased revenue might not necessary result in increased net profit as it also depends on the cost and expenses incurred by the company, increasing a company’s revenue is much harder than increasing its net profit as revenue is also dependent on many external factors that maybe beyond its control like economic cycle, but net profit can be increased through internal initiates of ongoing cost reduction and prudent cost management.
2. Increasing Revenue Growth
Increasing revenue growth trend in terms of growth percentage from year to year is a much greater sign of rising stock than absolute value of increasing revenue, as it shows the company is able to grow consistently over a sustainable period of time. Companies which can achieve positive growth % trend is very rare and if you come across r a company which has 3 years or more of consistent increasing revenue growth percentage, e.g. X% to Y% to Z% revenue growth (where Z > Y > X), add it into your watch list, monitor closely to look for opportunity to take position.
3. Increasing Net Profit Margin
An increasing net profit margin in percentage terms from year to year shows that the company has great operational cost control and/or its product is able to demand an increasing premium in the market. This is a great sign as it means higher net profit to the company and naturally its stock price will move upwards.
4. Increasing Dividend Amount
Dividends are paid from the net earnings of the company to the shareholders. When the dividend pay-out amount is increasing from year to year, with its dividend pay-out ratio remains almost the same, it means that the company has increasing net earnings from year to year. It is important to note that we should compare the absolute amount of dividend in this case instead of dividend yield as dividend yield fluctuates together with the company’s share price. A good company who believes in rewarding its shareholders with dividend will typically increase its absolute amount of dividend to maintain the dividend yield % when the share price moves up over the years.
5. Low Total Debt to Equity Ratio
Total Debt to Equity Ratio is simply dividing the company’s total debt value versus its shareholder equity value. Companies with Total Debt to Equity ratio less than 0.5 is consider healthy whereas less than 0.2 are consider excellent.
With low debt, the company is able to withstand economy downturns better and spend more of its net earnings in paying dividend to reward its shareholders, as well as invest in capital expenditure to grow its market share instead of paying off its debts. This financial aspect might not be applicable in some industries such as airlines, banks and telecommunication companies as it is their industry nature to have high debt due to intensive capital investments.
Signals of Rising Stock – SHORT TERM
1. Stock Trading in Accumulation Phase
As discuss in previous “iVSA Article 16 - Importance of Market Structure & How to Identify Them” http://klse.i3investor.com/blogs/ivsatradingtipsandplans/100977.jsp, when stocks are trading in accumulation phase, it is very likely that it will rise after smart money have successfully achieve its net buying and wants to generate profit by starting a Mark Up stage. Winning trader or investor should follow the footprints of smart money to take position during Accumulation stage then let the profit run in the anticipated Mark Up stage. Aspects on how to identify an Accumulation stage has been discussed in the previous “iVSA Article 16 - Importance of Market Structure & How to Identify Them”.
2. Stock Trading near Support
As discussed in previous “iVSA Article 14 - Importance of Chart Reading” http://klse.i3investor.com/blogs/ivsatradingtipsandplans/99754.jsp, with regards to identifying support and resistance, support is a price line which is difficult for a stock to breakthrough downwards unless there is substantial volume. When the stock is trading close to its support line and volume is low when it hits the support, it is very likely that the stock will rebound and move upwards as it does not have enough volume for the breakthrough. A winning trader or investor should identify the support line for a stock and take position when stock price is near support as this represent a great reward to risk ratio and high odds of becoming a winning trade, especially smart money footprints have been detected during the Accumulation around the support level.
3. Share Price Decreases Drastically Due to Bad News
At first look it might seem to be a warning sign of a decreasing stock instead of increasing, however being a winning trader or investor, we should always be mindful of news as most of them are engineered so that smart money operators can purchase these stock at a good price after its price have been pushed down.
The uninformed and uneducated public traders/investors will be panic by such bad news and rush to sell off their positions, smart money will then absorb these selling at a low price and start to accumulate. Therefore, being a winning trader or investor, when bad news is announced and stock price fells drastically, it’s time to take note and be prepared to take position when you detect smart money footprints in accumulating the stock. This is where you will get trade with very good reward-to-risk ratio.
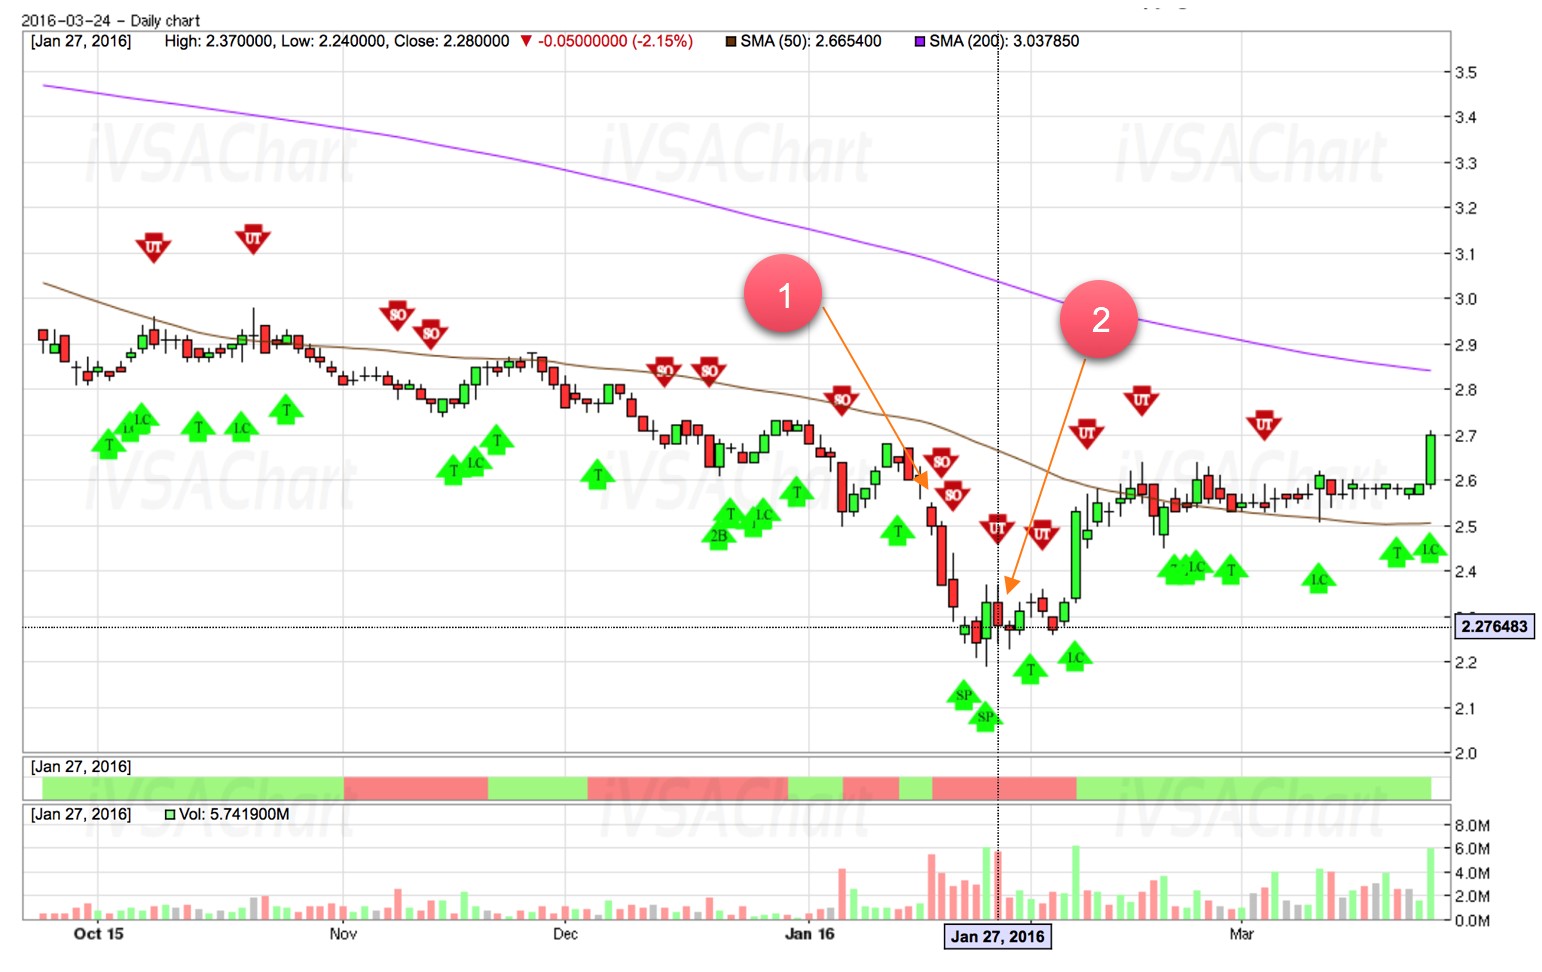
Example below shows a telco company listed in SGX. Point 1 is a dip in price due to bad news regarding net profit down 2.1% in Fourth Quarter FY2015. This is followed shortly by a bad news announcement that one of the big shareholder of the telco is planning to sell its stake at Point 2. However, within a few days the share price rises back without any release of good news and eventually the big shareholder did not sell its stake. Once again news is engineered for the smart money to buy low sell high and take advantage of most of the uneducated public trader/investor with herd mentality who rely on news and safety in numbers.
4. Increasing Volume during Accumulation stage
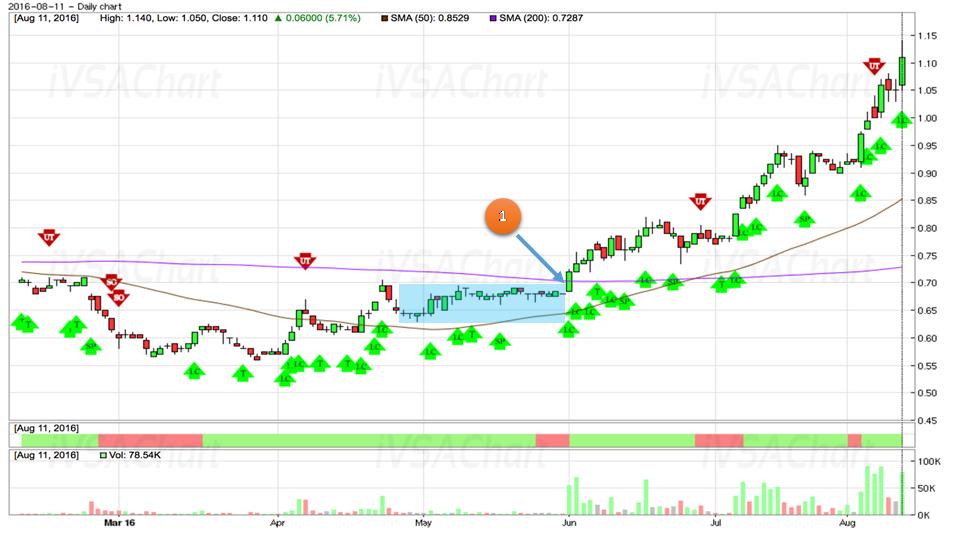
Increasing volume during Accumulation stage is a likely sign of smart money is transitioning from Accumulation to Mark Up stage. Example below is a KLSE stock whereby transition from Accumulation to Mark Up stage is shown around the blue shaded area before Point 1. The blue shaded area is Accumulation stage and Point 1 is the start of Mark Up stage with accompany volume. Do take note of the difference in volume before and after Point 1.
5. Announcement of Quarterly Results
Period close to impending quarterly result announcement often triggers larger moves in share price. When a company announces a good quarterly results, naturally its share price will go up for short term. However, it is always difficult to know beforehand whether the quarterly announcement is good or bad results.
One way to anticipate this with greater accuracy is to identify its market structure few weeks before its quarterly result announcement date. If smart money footprints of acquiring the stock in a subtle manner is detected during Accumulation stage, it is likely that good results are forth coming. More details on how to identify Accumulation stage was discussed in previous “iVSA Article 16 - Importance of Market Structure & How to Identify Them”.
Below is an example of a SGX stock whereby Point 1 is the after effect of good quarterly announcement versus Point 2 is the after math of bad quarterly announcement. The most important difference between Point 1 and Point 2 is that period before Point 1 there has been many weeks of Accumulation stage with smart money footprints but not the case for the period before Point 2

Conclusion
The ten signals of rising stocks outlined in this educational article for newbies are some of the basic signs that a winning trader or investor should put efforts to acquire the knowledge in order to be able to look out for these signs. These signs may happen independently at different timings or may be a few in concurrent. The skills to spot these signals require proper knowledge, time and experience to master, as part of your journey to be a winning trader or investor.
Remember this – Trading is to generate income and investment is to build wealth. Both are proven to help winning trader and investor worldwide who have acquired proper knowledge and skills through proper education to achieve their financial goals earlier than those who rely on free stock tips and rumours to punt/gamble in the stock market for short term thrills but will lose lots of money in the end. What is free in the trading and investment world will cost you dearly ultimately as this is how smart money operates!
Watch out for next and FINAL article in this series of education articles brought to you by iVSAChart, “iVSA Article 19 – Ten Challenges and Opportunities in Stock Market” under Series D: Daily Guide for Traders & Investors.
Interested to learn more?
- Join our annual Investment & Market Outlook Conference on 28 Aug 2016. Free door gift WORTH RM50 awaits you. Find out more via: https://www.ivsachart.com/investconference2016.php
- Free eBook available now! Click this URL to get your free eBook of “Get Rich with Dividends by Bill Wermine and Martin Wong”: http://ivsa.getresponsepages.com/
- Find out more about iVSAChart events via: https://www.ivsachart.com/events.php
- Follow & Like us on Facebook via: https://www.facebook.com/priceandvolumeinklse/
- Contact us via: email at sales@ivsachart.com or Call/WhatsApp at +6011 2125 8389/ +6018 286 9809/ +6019 645 3376
This article only serves as reference information and does not constitute a buy or sell call. Conduct your own research and assessment before deciding to buy or sell any stock. If you decide to buy or sell any stock, you are responsible for your own decision and associated risks.
More articles on iVSA Trading Tips and Plans
iVSA Article 19 - Ten Challenges and Opportunities in Stock Market
Created by Joe Cool | Sep 29, 2016
iVSA Article 16 - Importance of Market Structure & How to Identify Them
Created by Joe Cool | Jul 30, 2016
Discussions
2 people like this. Showing 11 of 11 comments
The best is to identify smart money accummulation,and be able to measure at the same time the STRENGTH of accummulation..
2016-08-29 23:52
Some counters on bad news, will have strong accummulation, this counters must be detected
2016-08-29 23:56
Anything to do with SMART MONEY and how they opperate should be detected
2016-08-29 23:57
Ivsa chart should have a daily article or weekly on SMART MONEY ACCUMMULATION, which counters they are fiddling with, and it s strength
2016-08-30 00:01
This articles ivsa chart can put it in this i3 site..if it is accurate then sure in the long run will benefit ivsa chart, many will join them as traders
2016-08-30 00:05
We have to see what you say on SMART MONEY ACCUMMULATION first, before we step in to become members of ivsa chart team,,put your daily or weekly articles on it on this i3 site, and make sure you have some counter picks base on your oppinion
2016-08-30 00:10
Which of the counters always being fiddle up by smart money, also must be detected, plus it s strength measured
2016-08-30 00:13
Post a Comment
Featured Posts


Latest Videos


Apps


Top Articles
1
Stock Market Enthusiast
Top 3 AI/Data Center Newsflow for the 3rd Week of December - #TENAGA, #YTL, #YTLPOWER
3
4
save malaysia!
5
save malaysia!
6
save malaysia!
7
Good Articles to Share
China property flare-ups resurface as crisis enters fifth year
8
#
Stock
Score
Daily Stocks
Stock Name
Last
Change
Volume
Stock Name
Last
Change
Volume
Stock Name
Last
Change
Volume
MQ Trading Signals
Stock
Time
Signal
Duration
Stock
Time
Signal
Duration
Featured Advertisers / Partners


Ride The Bull Short The Bear
CS Tan
4.9 / 5.0
This book is the result of the author's many years of experience and observation throughout his 26 years in the stockbroking industry. It was written for general public to learn to invest based on facts and not on fantasies or hearsay....
Bruce88
No. 11 - You MUST use my chart ! LOL
2016-08-21 14:29